VR System Illustration Diagram – Innovative Business Model
RJ0400065_24
- Last Update 06/05/2025
- File Size 0.5MB
- # of Slides 2
- File Format PPTX
- Slide Ratio 16:9
- Color
Keywords
- #Content-Based Slides
- #Design-Based Slides
- #Company Introduction
- #Business Introduction
- #Diagram
- #Business Areas
- #Business Areas
- #Spread
- #Decentralized Diagram
- #16:9
- #radial diagram PowerPoint
- #three-value presentation slide
- #hexagon diagram template
- #business model illustration
- #isometric PowerPoint slide design
About the Product
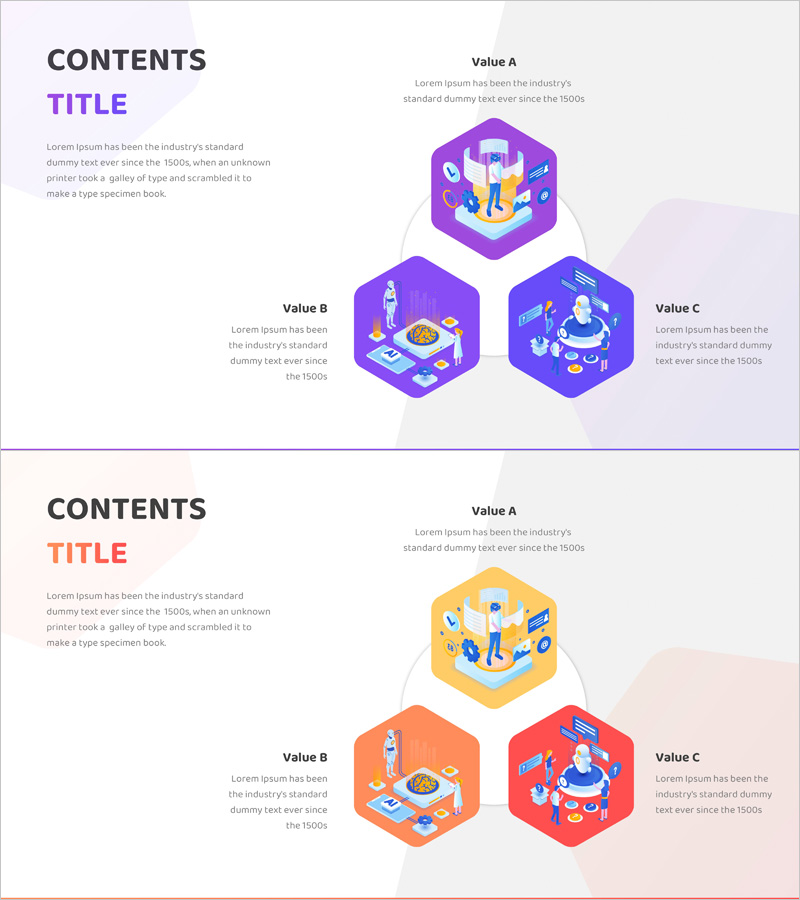
A three-value radial diagram PowerPoint slide that visualizes business models and innovation strategies through an isometric hexagon structure. The design radiates three core values (Value A, B, C) from a central concept, with layered descriptions and illustrative elements representing people, technology, and data within each hexagon. Two color versions—purple and orange—are included to match different brand tones. This presentation slide is ready to use for business model introductions, product value propositions, strategic pillar explanations, and corporate presentations.
Usage Points
-
Main Usage
Visualizes three core business values radiating from a central concept, clearly communicating strategic direction and hierarchical relationships. Ideal for business introductions, product value propositions, organizational pillars, marketing strategies, and any presentation requiring three-part value explanation.
-
How to Use
Enter value names and descriptions in each hexagon text area, and add supporting information in the left content section. Select the color version (purple or orange) that matches your brand identity. Use slide animations to emphasize the center-to-radial flow sequence during presentation.
-
Recommended For
Business strategy presentations, new business proposals, product launch decks, organizational structure explanations, marketing plans, investor pitch decks, consulting reports, and any presentation where three core values need clear visual hierarchy and explanation.
-
Slide Structure
Two-section layout: left content area (title and descriptive text) and right diagram area. The diagram features Value A hexagon at top center, Value B at bottom left, and Value C at bottom right, each containing isometric illustrations of people, technology, and data elements.
Related Products
-

Soft Power Sector Diagram – Optimized for Business Introduction
#Company Introduction #Business Introduction #Diagram
-

Smart Home Service Area Diagram – Business Introduction and Areas
#Company Introduction #Business Introduction #Diagram
-

Fintech Business Area Diagram – Visualizing Business Overview
#Company Introduction #Business Introduction #Diagram
-

Medical Business Area Diffusion Diagram – Visualization of Business Introduction
#Company Introduction #Business Introduction #Diagram
