Diffusion Connection Circular Diagram – Product/Service Introduction
RJ0400061_12
- Last Update 06/03/2025
- File Size 0.3MB
- # of Slides 2
- File Format PPTX
- Slide Ratio 16:9
- Color
Keywords
- #Content-Based Slides
- #Design-Based Slides
- #Product/Service Introduction
- #Business Introduction
- #Diagram
- #Composition
- #Business Areas
- #Spread
- #Radial Diagram
- #16:9
- #radial diagram PowerPoint
- #diffusion connection diagram slide
- #8-node PowerPoint template
- #product introduction diagram
- #business domain PPT slide
- #how to create radial diagram in PowerPoint
About the Product
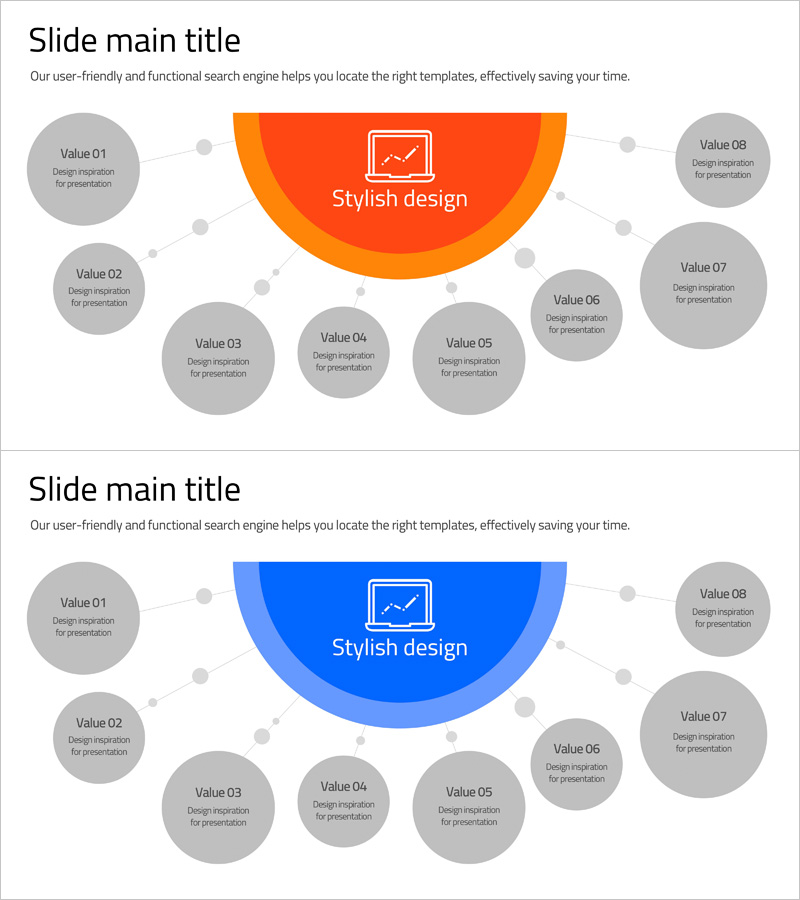
A radial diffusion diagram PowerPoint slide that expands from a central concept to eight surrounding items. Available in two color versions—orange and blue—with uniform gray circular nodes that clearly represent information hierarchy. Ideal for product and service introductions, business domain classifications, and organizational function explanations where a core concept radiates outward to related elements. The 2-slide set is ready to use immediately, with fully editable text fields for customization.
Usage Points
-
Main Usage
This radial diagram places a core concept or theme at the center and expands it outward to eight related items. It effectively visualizes product features, service components, business domain divisions, and organizational department functions in a clear, hierarchical structure.
-
How to Use
Enter the main concept in the central orange or blue semicircular area, then add specific items to each of the eight surrounding gray circular nodes. Connection lines and dots represent relationships to the center. Choose the color version that matches your presentation theme and audience.
-
Recommended For
Recommended for product team feature presentations, marketing department service area explanations, executive reports on business portfolios, new employee training materials on organizational structure, and consulting proposals showing solution components.
-
Slide Structure
Two-slide set with orange and blue color variations of the radial diagram. Each slide features a central semicircular icon area, eight equally-sized gray circular nodes, connecting lines, and dots. Optimized for 16:9 widescreen format with fully editable text and shape elements.
Related Products
-

Mapping Key Business Areas – Effective Business Presentation
#Product/Service Introduction #Business Introduction #Diagram
-

Square Frame Template for Business Area Introduction – Innovation and Design
#Product/Service Introduction #Business Introduction #Composition
-

Mission Diagnostics Dashboard Slide for System Monitoring
#Product/Service Introduction #Operational Plan #Diagram
-

Technical Configuration Diagram – Information Spreading Visually Centered
#Product/Service Introduction #Business Introduction #Diagram
