SWOT Analysis Diagram – Market and Competitor Analysis
RJ0400058_23
- Last Update 06/02/2025
- File Size 0.1MB
- # of Slides 2
- File Format PPTX
- Slide Ratio 16:9
- Color
Keywords
About the Product
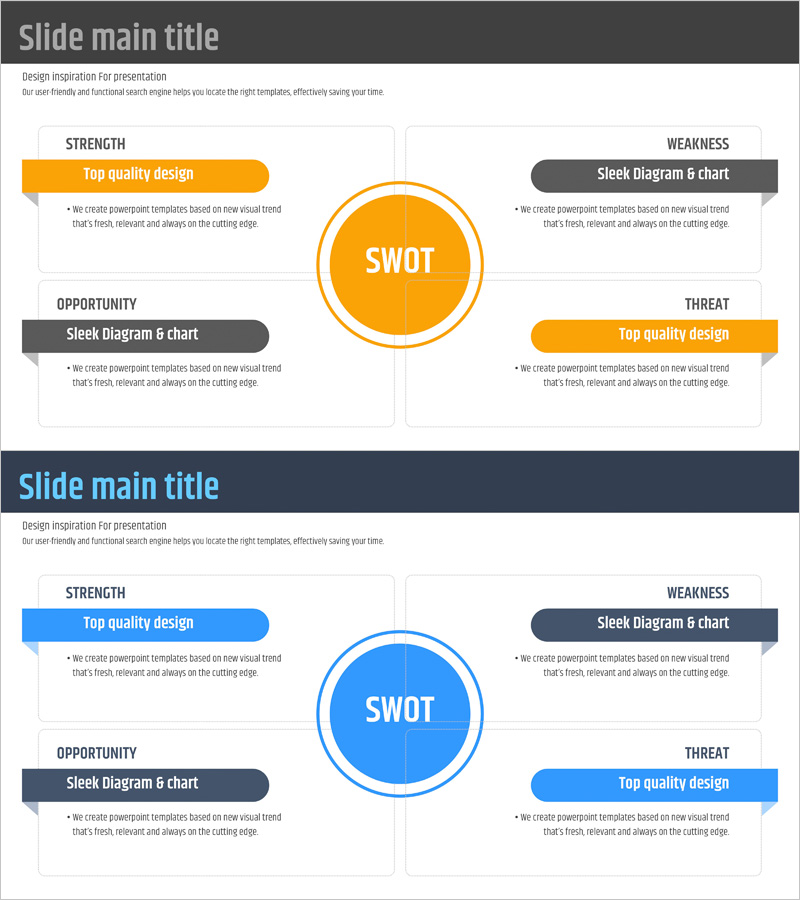
A SWOT analysis diagram PowerPoint slide featuring a central circular hub with four directional quadrants for Strength, Weakness, Opportunity, and Threat. Each quadrant is designed with callout text boxes to accommodate detailed analysis content for market assessment and competitive positioning. Available in two color versions—orange and blue—this slide deck provides immediate usability for business strategy presentations and planning documents. The 16:9 widescreen format includes 2 slides, making it ideal for comprehensive SWOT analysis in strategic planning, product launch, and competitive intelligence presentations.
Usage Points
-
Main Usage
Systematically analyze and visualize organizational strengths, weaknesses, opportunities, and threats during strategic planning phases. The central circular hub with four directional quadrants creates an intuitive representation of SWOT relationships, making it suitable for market entry strategies, new product planning, and competitive positioning presentations.
-
How to Use
Input analysis content into the callout text boxes within each quadrant (Strength, Weakness, Opportunity, Threat). Use the orange version for warm-toned presentations and the blue version for corporate credibility. The 2-slide structure allows the first slide to present the analytical framework and the second to display detailed findings and strategic recommendations.
-
Recommended For
Executives, strategy managers, marketing planners, business development teams, and consultants preparing executive briefings, strategic planning reports, investor pitch decks, and business plans. Particularly effective for market analysis, competitive strategy development, and business feasibility assessment presentations.
-
Slide Structure
Central circular hub positioned at the center with SWOT text, surrounded by four directional quadrants (top, bottom, left, right) containing callout text boxes for Strength, Weakness, Opportunity, and Threat respectively. Each quadrant provides independent input space, with visual connectors linking the central hub to each quadrant, creating a unified analytical flow.
Related Products
-

Natural SWOT Analysis Slide – Designed with Nature
#Market and Competitor Analysis #Diagram #SWOT Analysis
-

SWOT Analysis of Children's Music Activities – Effective Strategy Development
#Market and Competitor Analysis #Diagram #SWOT Analysis
-

SWOT Analysis of Popular Career Dreams for Kids
#Market and Competitor Analysis #Diagram #SWOT Analysis
-

SWOT Analysis Box Diagram – Essential Tool for Market Analysis
#Market and Competitor Analysis #Diagram #SWOT Analysis
