Target Country Analysis Graph – Visual Insights into Markets
RJ0400057_17
- Last Update 06/02/2025
- File Size 0.6MB
- # of Slides 2
- File Format PPTX
- Slide Ratio 16:9
- Color
Keywords
- #Content-Based Slides
- #Design-Based Slides
- #Market and Competitor Analysis
- #Marketing Plan and Strategy
- #Other
- #Target Market
- #Target Market Strategy
- #16:9
- #target country analysis PPT slide
- #global market comparison PowerPoint
- #market analysis chart template
- #geographic data visualization
- #how to create market analysis slides in PowerPoint
About the Product
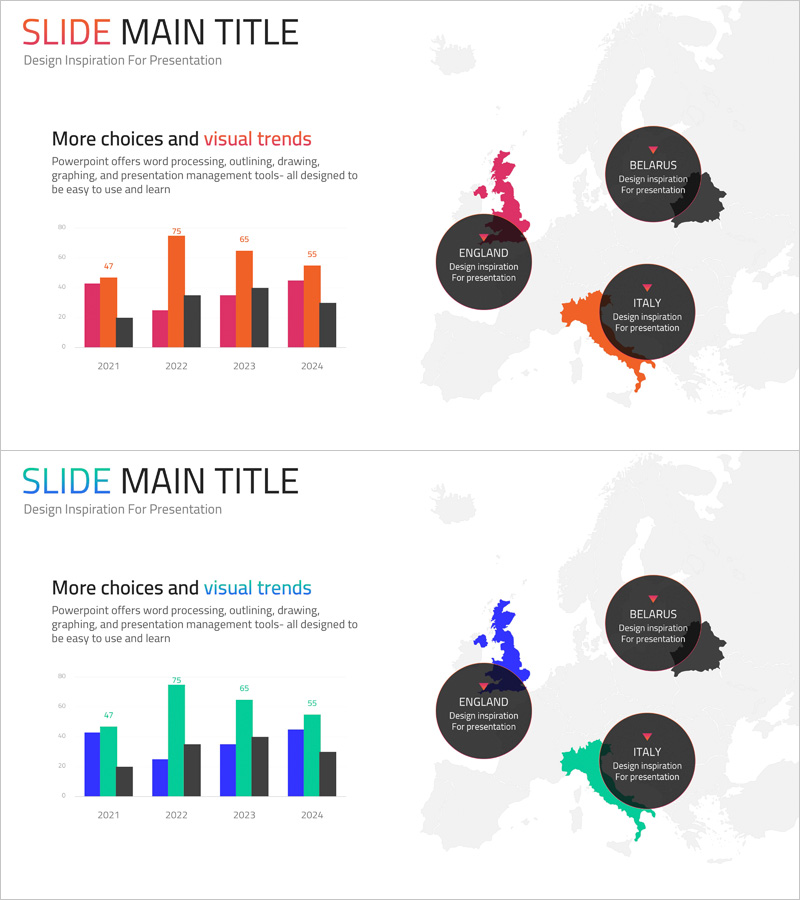
An essential PowerPoint slide for developing global market entry strategies, featuring a dual-layout design that combines data visualization with geographic context. The left side displays a multi-year bar chart tracking market trends across four years with color-coded data series in orange, pink, and black. The right side presents a world map with country-specific data highlighted through circular callout bubbles, enabling quick visual comparison of target markets. This 2-slide presentation template uses contrasting colors to emphasize data hierarchy and includes dedicated text areas for contextual explanations. Optimized for 16:9 widescreen format, it integrates seamlessly into modern business presentations for market analysis, competitive positioning, and strategic planning discussions.
Usage Points
-
Main Usage
Enables side-by-side comparison of target market metrics including market size, growth rates, and competitive landscape across multiple countries. The dual-view approach—combining temporal trends with geographic distribution—provides comprehensive market intelligence for strategic decision-making.
-
How to Use
Insert this slide in the market analysis section of your presentation to justify target country selection. Populate the left bar chart with actual revenue, market share, or growth rate data, and label the map regions with country names and key performance indicators. Customize colors to match your corporate branding.
-
Recommended For
Marketing managers, business development professionals, and executives preparing market analysis sections for business plans, marketing proposals, and investor pitch decks. Ideal for companies planning global expansion or entering new geographic markets.
-
Slide Structure
Two-slide set with color variations (orange-accent and teal-accent versions). Each slide contains a 4-year × 4-series bar chart on the left (6 text input areas) and a world map with 3 country callout bubbles on the right (4 data entry zones). Fully editable chart data and map labels.
Related Products
-

US Target Market Analysis Map
#Market and Competitor Analysis #Marketing Plan and Strategy #Other
-

Logistics Coverage Across the U.S.
#Market and Competitor Analysis #Marketing Plan and Strategy #Other
-

Analysis of the American Drug Addiction Problem Slide Template
#Market and Competitor Analysis #Marketing Plan and Strategy #Other
-

Business USA Target Market Analysis – Predicting the Future with Data
#Market and Competitor Analysis #Marketing Plan and Strategy #Other
