Medical Business Area Diffusion Diagram – Efficient Connections
RJ0400045_32
- Last Update 05/29/2025
- File Size 3MB
- # of Slides 2
- File Format PPTX
- Slide Ratio 16:9
- Color
Keywords
- #Content-Based Slides
- #Design-Based Slides
- #Company Introduction
- #Business Introduction
- #Diagram
- #Business Areas
- #Business Areas
- #Spread
- #Centralized Diagram
- #16:9
- #radial diffusion diagram PowerPoint
- #central hub diagram slide
- #3-node connection template
- #business area expansion PPT
- #diagram PowerPoint template download
About the Product
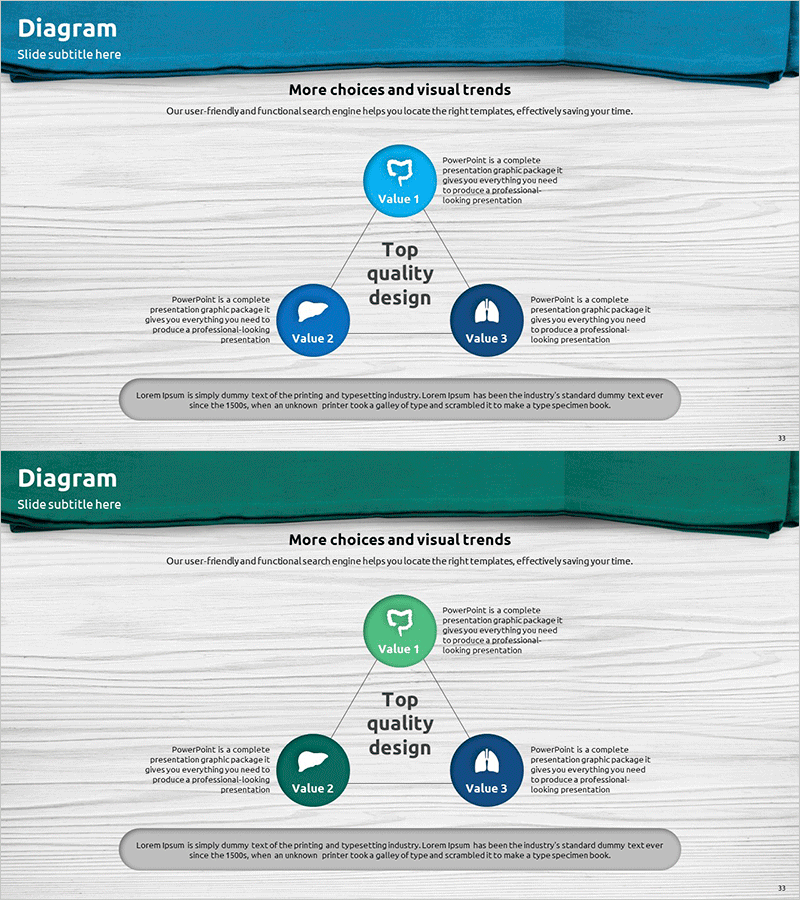
A radial diffusion diagram PowerPoint slide that expands from a central concept to three value nodes in a sunburst pattern. The center circular node connects to surrounding nodes via directional arrows, ideal for illustrating business areas, product lines, strategic directions, or organizational functions. Features blue, green, and navy circular icons against a light gray background with text description areas positioned beside each node for clear information delivery. The 2-slide set includes color variations (blue tone and green tone) allowing flexible presentation styling. Fully editable PPTX format enables quick customization of node labels and descriptive text for immediate use in business presentations.
Usage Points
-
Main Usage
Visually represents core concepts that branch into multiple related items such as business domains, product portfolios, strategic initiatives, or organizational functions. The center-focused structure emphasizes the primary concept while clearly showing the interconnected relationships among supporting elements.
-
How to Use
Apply this diagram in strategy and business overview sections of presentations to explain core values, business portfolios, or organizational structure. Enter the main topic in the central node, add specific items to the three surrounding nodes, and fill in descriptive text boxes. Use color variations to differentiate presentation sections and maintain visual consistency.
-
Recommended For
Recommended for executives, strategy teams, marketing departments, and business development teams presenting business plans, proposals, and investment materials. Particularly effective for healthcare, pharmaceutical, technology, and financial sectors when visualizing business domain classification, portfolio composition, and strategic planning outcomes.
-
Slide Structure
Central circular node (Value 1) with three surrounding circular nodes (Value 2, Value 3, and additional item) connected via directional arrows. Text description areas positioned beside each node accommodate detailed information. Blue, green, and navy circular icons provide visual emphasis and hierarchy.
Related Products
-

Infographic Slide Visualizing Collaborative Business Areas
#Company Introduction #Business Introduction #Diagram
-

Sketch Icon Business Area Diagram – Visualizing Business Introduction
#Company Introduction #Business Introduction #Diagram
-

Card Payment Service Area Diagram – Business Sector Introduction
#Company Introduction #Business Introduction #Diagram
-

Financial Management Services Area Diagram – Visualizing Business Areas
#Company Introduction #Business Introduction #Diagram
