3D Printing Business Area Diagram – Innovative Business Introduction
RJ0400036_17
- Last Update 05/27/2025
- File Size 1.7MB
- # of Slides 2
- File Format PPTX
- Slide Ratio 16:9
- Color
Keywords
- #Content-Based Slides
- #Design-Based Slides
- #Company Introduction
- #Business Introduction
- #Diagram
- #Business Areas
- #Business Areas
- #Spread
- #Radial Diagram
- #16:9
- #radial diagram PowerPoint
- #center-based diagram slide
- #4-node diagram template
- #business area introduction PPT
- #how to create radial diagram in PowerPoint
About the Product
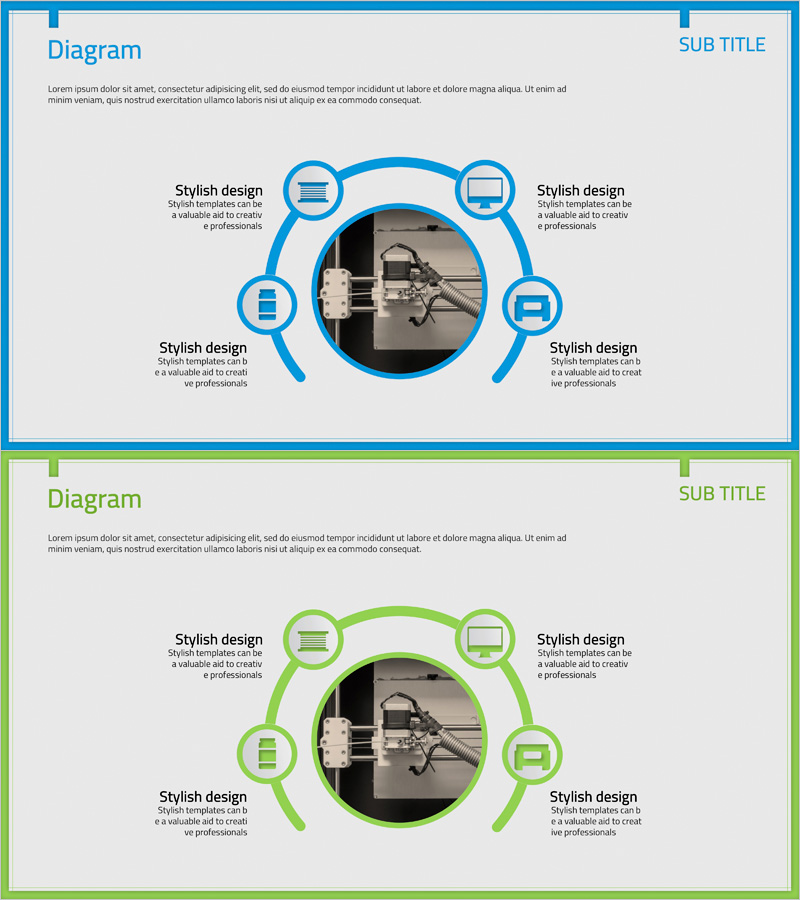
A PowerPoint slide featuring a radial diagram structure with four nodes extending outward from a central image. Available in two color versions—blue and green—each node includes an icon and text description area. This design is ideal for presenting business areas, product functions, service features, or core values in relation to a central concept. The 2-slide set is ready to edit and use immediately in your presentations.
Usage Points
-
Main Usage
Visualizes how four related items extend from a central concept or theme. Effectively communicates business area introductions, product feature explanations, service characteristics, organizational structures, and other center-to-periphery relationships in a clear, visually engaging format.
-
How to Use
Place your core image or logo in the central circular area, then add item names and descriptions to each of the four nodes. Select the color version that matches your company branding or presentation theme. Icons can be customized to reflect the characteristics of each item.
-
Recommended For
Ideal for new business introductions, product diversification strategies, service portfolio presentations, organizational department overviews, and core value communications. Recommended for company introductions, business plans, marketing proposals, and investor pitch decks.
-
Slide Structure
2-slide set. Each slide features a central circular image area with four nodes (icon + text box) positioned at top, bottom, left, and right in a radial arrangement. One slide in blue version and one in green version are provided.
Related Products
-

Business Sector Structure Hexagon Diagram – Visual Trend Introduction
#Company Introduction #Business Introduction #Diagram
-

Square Frame Presentation Template – Business Area Explanation
#Company Introduction #Business Introduction #Diagram
-

Business Area Circular Connection Diagram – Connecting Business Strategies
#Company Introduction #Business Introduction #Diagram
-

Diagram Introducing Business Activity Areas – Visualizing Business Areas
#Company Introduction #Business Introduction #Diagram
