LMO Gender Comparison Analysis Graph – Market Share and Customer Analysis
RJ0400031_18
- Last Update 05/26/2025
- File Size 7.9MB
- # of Slides 2
- File Format PPTX
- Slide Ratio 16:9
- Color
Keywords
- #Content-Based Slides
- #Design-Based Slides
- #Market and Competitor Analysis
- #Other
- #Customer Analysis
- #Market Share
- #Silhouette
- #16:9
- #gender comparison analysis PPT
- #infographic slide PowerPoint
- #silhouette chart slide
- #market analysis presentation
- #how to create demographic comparison in PowerPoint
About the Product
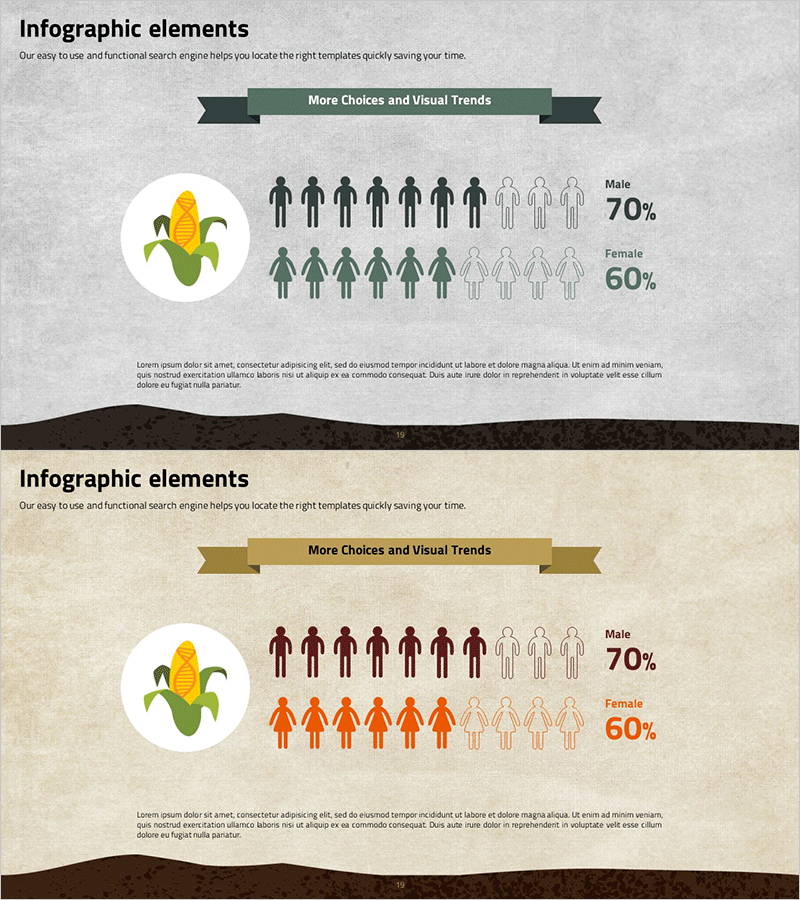
A 2-slide PowerPoint presentation designed to visualize gender comparison analysis data. Features a gray background with green banner header, corn icon, and male/female silhouette icons in an infographic layout. Each slide clearly displays ratio data (70%, 60%) and is ideal for market share analysis, customer demographics, and population statistics. The text description area and data visualization area are separated, making it ready for immediate use in presentations.
Usage Points
-
Main Usage
Visualizes gender, demographic, and customer segment comparison data intuitively. Combines silhouette icons with percentage figures to clearly communicate male/female ratios, market share distribution, and customer composition analysis.
-
How to Use
Use in market analysis, customer analysis, and demographic sections when presenting gender composition, target audience distribution, and user ratios. Edit the text area with your analysis content while maintaining the icons and figures for consistent design throughout your presentation.
-
Recommended For
Ideal for marketing plans, business proposals, market analysis reports, customer analysis documents, and demographic presentations. Perfect for marketing professionals, data analysts, HR specialists, researchers, and business strategists in finance, retail, and technology sectors.
-
Slide Structure
2-slide layout with each slide divided into 4 sections: title area (banner header), left icon area (corn image), center comparison area (male/female silhouettes with percentages), and right text description area. Optimized for 16:9 widescreen format.
Related Products
-

Drug Addiction Gender Ratio Analysis Graph - Customer Analysis
#Market and Competitor Analysis #Graph #Other
-

Collaboration Silhouette Diagram – Visual Tool for Customer Analysis
#Market and Competitor Analysis #Graph #Other
-

Comparison of Company Employee Job Fields – Understanding Diverse Roles of Employees
#Technical Approach #Market and Competitor Analysis #Diagram
-

User Analysis Status by Country – Insights and Vision
#Market and Competitor Analysis #Other #Customer Analysis
