Chromosome Analysis Diagram – Visual Representation of Cluster Structures
RJ0400019_16
- Last Update 05/22/2025
- File Size 1MB
- # of Slides 2
- File Format PPTX
- Slide Ratio 16:9
- Color
Keywords
- #Content-Based Slides
- #Design-Based Slides
- #Technical Approach
- #Diagram
- #System Architecture Diagram
- #Research and Development
- #Cluster
- #Closed Cluster Diagram
- #Chain Diagram
- #16:9
- #chromosome diagram PowerPoint
- #cluster structure presentation
- #hierarchical network slide
- #genetic analysis PPT
- #data relationship diagram
- #technical visualization template
About the Product
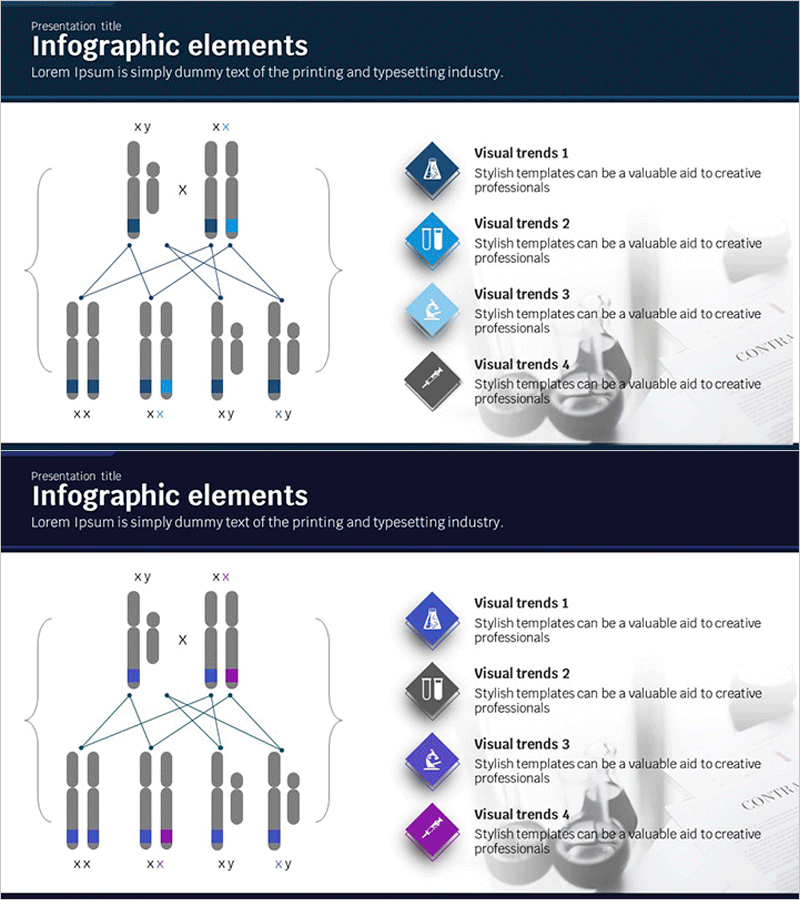
A cluster diagram PowerPoint slide that visualizes chromosome analysis and genetic connection structures. The design features a hierarchical network expanding from 2 top nodes to 8 bottom nodes, ideal for representing complex data relationships in biology, medicine, and technology fields. Dark blue background with gray cylindrical nodes and blue accent colors emphasize professionalism, while linear connection lines and arrows clarify data flow. The 2-slide set offers multiple color combinations (blue, purple, gray) for flexible presentation contexts. Available in 16:9 widescreen PPTX format with full editing capability, suitable for academic presentations, technical explanations, and organizational structure discussions.
Usage Points
-
Main Usage
Optimized for visualizing complex data relationships and hierarchical connection structures. Ideal for chromosome analysis, genetic networks, organizational hierarchies, system architecture, and any technical content requiring multi-node interconnections.
-
How to Use
The structure expands from central top nodes to multiple bottom nodes, effectively illustrating classification and analysis processes from broad concepts to detailed items. Customize each node with text, adjust colors to highlight key elements, and use connection line thickness and arrow direction to indicate data flow priority.
-
Recommended For
Recommended for biology and genetics research presentations, IT and software engineers explaining system architecture, organizational development teams presenting organizational structures and reporting relationships, and data analysts visualizing complex data relationships.
-
Slide Structure
2-slide set with first slide featuring blue color scheme (dark blue background, gray nodes, light blue accents) and second slide in purple and gray tones. Each slide displays an 8-node hierarchical structure expanding from 2 top nodes to 8 bottom nodes, with all nodes connected by linear connection lines.
Related Products
-

Unique Connection Diagram – Perfect for Product/Service Introduction
#Product/Service Introduction #Technical Approach #Diagram
-

Gardening System Diagram – Optimizing Business Strategy Composition
#Business Strategy #Technical Approach #Diagram
-

System Architecture Slide – Visuals for Efficient Service Build
#Technical Approach #Diagram #Service Implementation Plan
-

Stylish Design-Based PowerPoint Template – A World of Limitless Possibilities
#Product/Service Introduction #Technical Approach #Product/Service Introduction
