Science Experiment Results Summary Slide – Innovation and Discovery
RJ0400019_15
- Last Update 05/22/2025
- File Size 1MB
- # of Slides 2
- File Format PPTX
- Slide Ratio 16:9
- Color
Keywords
About the Product
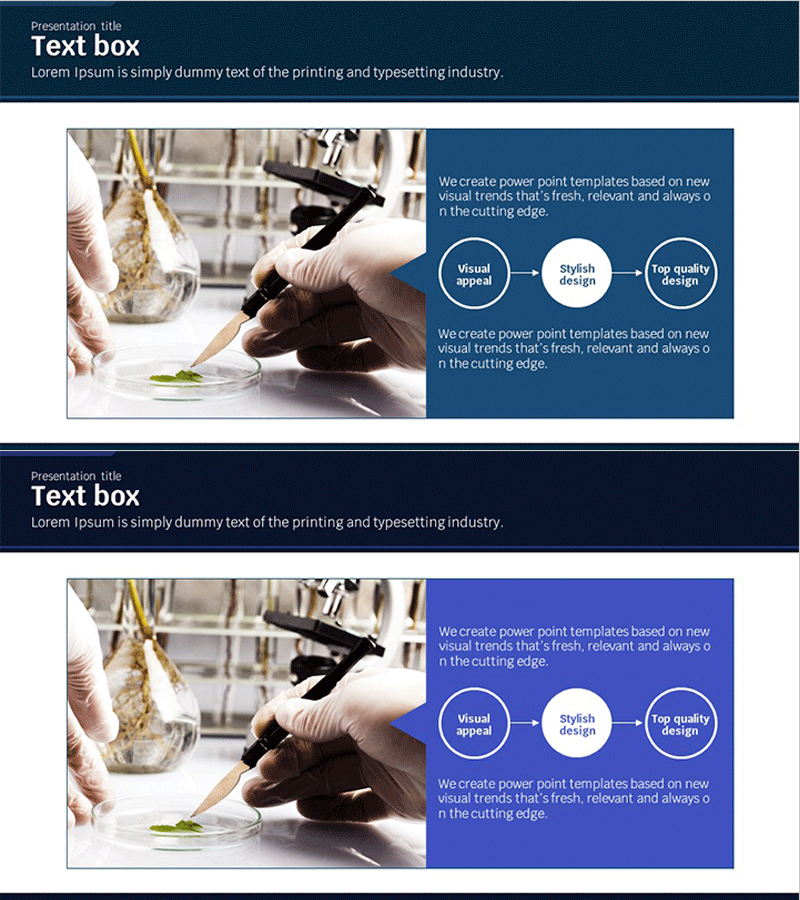
A PowerPoint slide template that visualizes science experiment results and innovation discovery processes using a 3-step connection diagram. The design features a dark blue background with white circular nodes connected by directional arrows, clearly expressing the causal relationships between experimental stages. The balanced layout combines a left image area with right-side text and diagram space, making it immediately applicable for scientific presentations, research reports, and technical seminar slides. The 16:9 widescreen format with 2-slide composition allows flexible customization for various experiment result summaries and process documentation.
Usage Points
-
Main Usage
Express the step-by-step process and causal relationships of scientific experiments through a 3-node connection diagram, enabling intuitive communication of complex research findings. The visual flow enhances audience comprehension and strengthens presentation persuasiveness for technical and academic contexts.
-
How to Use
Insert experiment photos or scientific materials in the left image area, then input stage names (e.g., Visual appeal → Stylish design → Top quality design) into each diagram node on the right. Add stage-by-stage explanations in the text area to create research reports or technical seminar presentation materials.
-
Recommended For
Recommended for research scientists and laboratory professionals, university lecturers and academic presenters, pharmaceutical and biotech R&D teams, educators requiring experiment result summaries, and technology managers explaining step-by-step project achievements in innovation initiatives.
-
Slide Structure
2-slide composition with each slide divided into 50% left image area and 50% right content area. The right section features a dark blue background with 3 white circular nodes connected by directional arrows in a left-to-right linear flow, accompanied by text input spaces for detailed explanations.
Related Products
-

Program Marketing Plan Diagram – Effective Strategy Development
#Operational Plan #Diagram #Production and Technology Development Strategy
-

Analysis of Meat Cooking Methods – Effective Cooking Preparation
#Product/Service Introduction #Operational Plan #Diagram
-

Analysis by 4 Areas Visualized Slide
#Business Introduction #Operational Plan #Diagram
-

Introducing an Efficient Solution to Solve the Problem – A New Paradigm for Business Operations
#Business Management #Operational Plan #Diagram
