Science Experiment Characteristics Diagram – Business Area Overview
RJ0400019_12
- Last Update 05/22/2025
- File Size 1MB
- # of Slides 2
- File Format PPTX
- Slide Ratio 16:9
- Color
Keywords
- #Content-Based Slides
- #Design-Based Slides
- #Product/Service Introduction
- #Business Introduction
- #Diagram
- #Features
- #Business Areas
- #Cluster
- #Chain Diagram
- #16:9
- #connected diagram PowerPoint
- #4-node diagram template
- #business area overview slide
- #cluster diagram PPT
- #how to create connected diagram in PowerPoint
About the Product
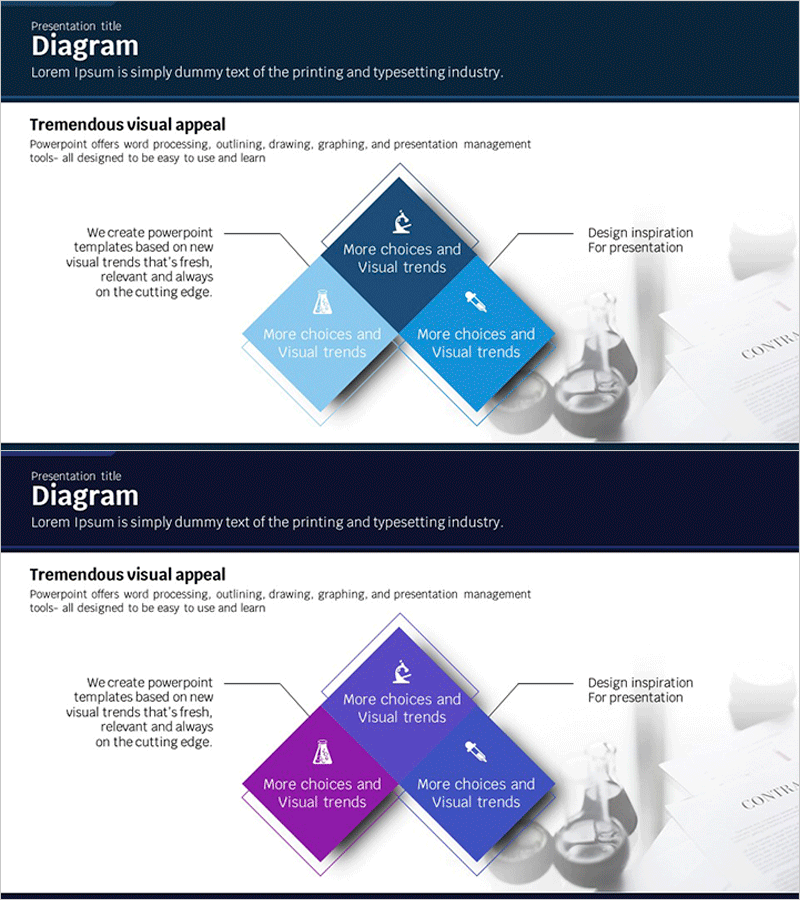
A connected diagram PowerPoint slide featuring a central diamond node with four directional branches extending outward. The design uses blue and purple gradient tones to create visual hierarchy and emphasis. The 2-slide set presents the same structural framework in two distinct color variations—blue and purple—allowing consistent design language throughout your presentation. Ideal for business area introductions, product characteristic analysis, organizational structure explanations, and strategic framework presentations. Fully editable and ready for immediate use in corporate presentations.
Usage Points
-
Main Usage
Positions a core concept or business element at the center and connects four supporting elements radiating outward, enabling stakeholders to grasp the complete structure at a glance. Effectively communicates product features, service divisions, organizational functions, or strategic pillars.
-
How to Use
Enter your core concept (company name, product name, strategic initiative) in the central diamond node. Add supporting details to the four surrounding nodes. Adjust text size based on content length and apply color coding by category to reinforce information hierarchy and visual clarity.
-
Recommended For
Business plans, company profiles, product launch presentations, organizational structure explanations, marketing strategy reports, executive briefings, investor pitch decks, and internal training materials. Particularly effective when clarifying relationships between a central concept and multiple supporting elements.
-
Slide Structure
One central diamond node (dark blue or purple) with four directional arrows extending to cardinal positions. Four outer diamond nodes (light blue or sky blue) positioned at the endpoints. Two-slide set provides identical structure in blue and purple color schemes for design flexibility.
Related Products
-

Cluster Diagram Slide Visualizing Business Field Characteristics
#Product/Service Introduction #Business Introduction #Diagram
-

Business Activity Areas Diagram – Clear Information Visualization
#Product/Service Introduction #Business Introduction #Diagram
-

Pentagon Connection Star Diagram - Cluster and Performance Introduction
#Product/Service Introduction #Business Introduction #Diagram
-

3D Printing Characteristics Diagram – Business Introduction with Innovation
#Product/Service Introduction #Business Introduction #Diagram
