Medical Business Sector Overlap Diagram
RJ0400018_33
- Last Update 05/22/2025
- File Size 0.3MB
- # of Slides 2
- File Format PPTX
- Slide Ratio 16:9
- Color
Keywords
- #Content-Based Slides
- #Design-Based Slides
- #Company Introduction
- #Business Vision and Strategy
- #Diagram
- #Business Areas
- #Business Vision
- #Cluster
- #Combination Diagram
- #16:9
- #overlap diagram PowerPoint
- #Venn diagram slide template
- #5-circle diagram
- #medical business sector slide
- #intersection diagram PowerPoint template
About the Product
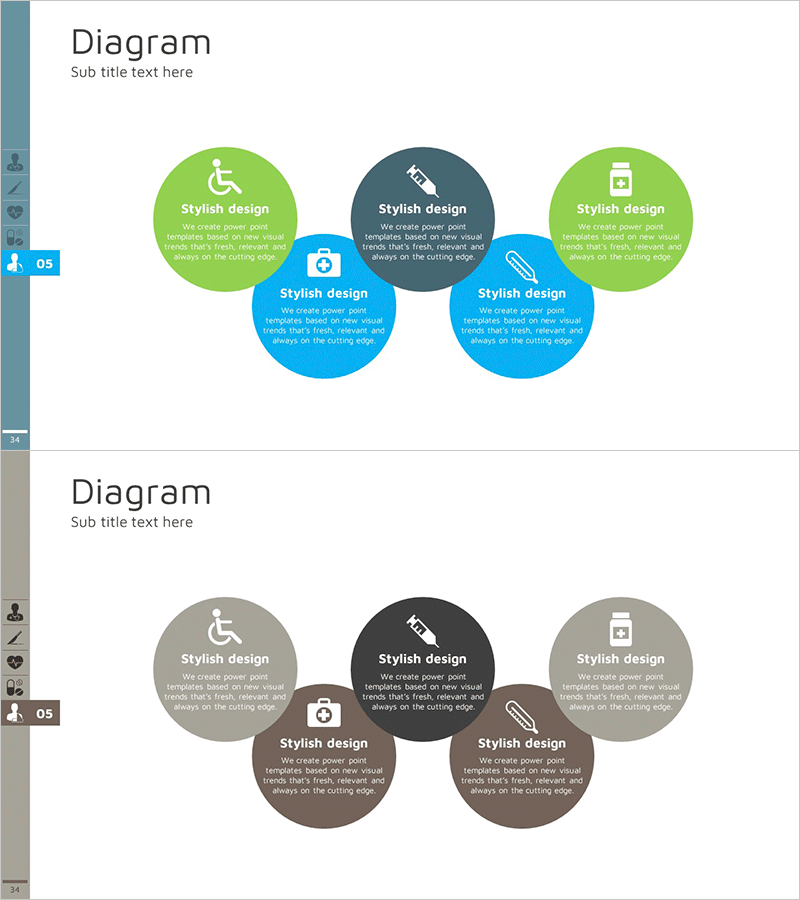
A Venn diagram-style PowerPoint slide featuring five circular nodes that overlap to represent intersection relationships in the medical business sector. Three distinct color schemes—lime green, sky blue, and dark slate—differentiate each area, with editable icon and text regions in every node. The 2-slide set includes a vibrant color version and a toned-down version for flexible presentation contexts. This slide deck effectively communicates complex relational data and cross-sector connections in healthcare and medical business presentations.
Usage Points
-
Main Usage
This slide is designed to clearly illustrate intersection relationships between multiple business sectors, organizations, or concepts. It visually demonstrates how different areas of the medical industry overlap and connect, enhancing audience comprehension. Ideal for strategic planning, business analysis, and organizational structure presentations.
-
How to Use
Edit the text and icons in each circular node with your own content. The lime green, sky blue, and dark slate colors can be retained or customized as needed. Use the color version for impactful presentations and the toned-down version for printed materials or formal documents.
-
Recommended For
Recommended for business strategy presentations in healthcare, medical devices, pharmaceuticals, and biotech sectors. Suitable for hospital executives, consulting firms, medical device companies, and pharmaceutical organizations presenting complex relationship diagrams and market analysis.
-
Slide Structure
Five circular nodes arranged around a central point with overlapping intersections. Each node contains an icon area and editable text region, with intersection areas also available for text input. Both slides maintain identical structure with color variations only.
Related Products
-

Business Vision Overlay Diagram – Effectively Visualizing Vision and Strategy
#Product/Service Introduction #Business Vision and Strategy #Diagram
-

Business Core Vision Slide – Utilizing Cluster Diagram
#Company Introduction #Business Vision and Strategy #Diagram
-

Pet Brand Mission – Cluster Diagram of Values and Vision
#Company Introduction #Business Vision and Strategy #Diagram
-

Business Vision Overlay Diagram – Harmony of Clusters and Analysis
#Product/Service Introduction #Business Vision and Strategy #Diagram
