Application Service Development Budget – Efficient Cost Management
RJ0400010_19
- Last Update 05/19/2025
- File Size 0.3MB
- # of Slides 2
- File Format PPTX
- Slide Ratio 16:9
- Color
Keywords
About the Product
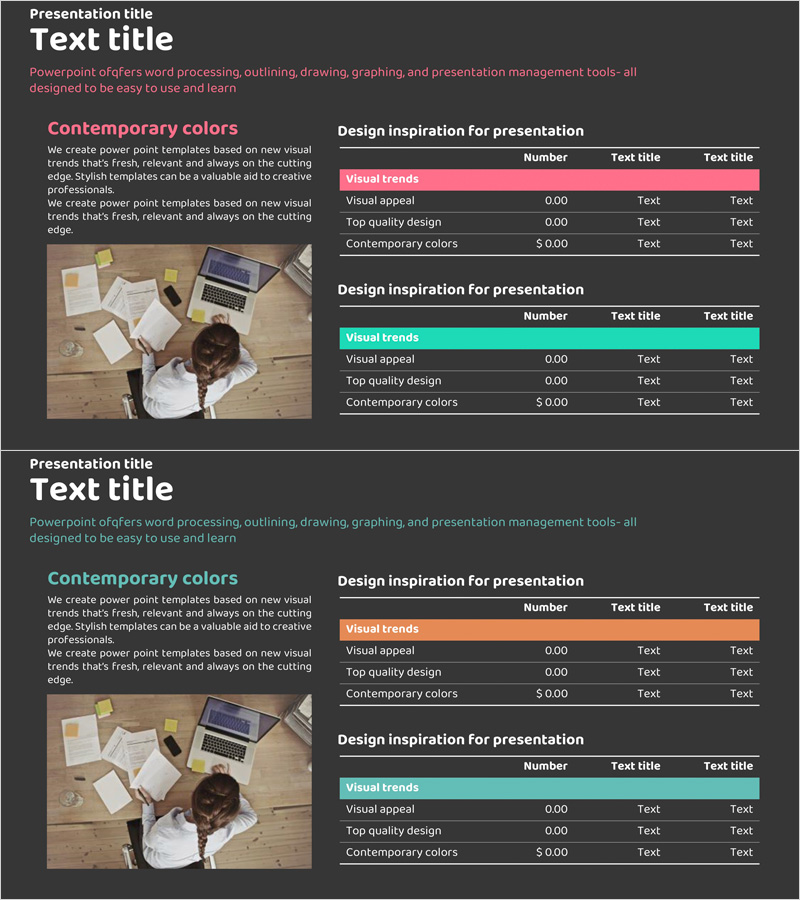
A 2-slide PowerPoint presentation template for managing application service development budgets with clarity and precision. Featuring a dark gray background with pink and cyan header rows, this table-based slide deck presents a 3-row structure ideal for organizing financial data by category. Each slide displays four comparison metrics: Visual Trends, Visual Appeal, Top Quality Design, and Contemporary Colors, making it perfect for cost analysis, budget allocation, and financial planning presentations. Delivered in 16:9 widescreen PPTX format, ready for immediate use in project finance reviews and stakeholder reporting.
Usage Points
-
Main Usage
Organize project budgets, cost categories, and financial metrics in a structured row-column format to enable quick numerical comparison and trend analysis. Designed to present application development budget allocation, spending trends, and departmental cost breakdowns in a single, comprehensible view.
-
How to Use
Input budget line items, projected costs, actual expenses, and variances into each table cell to create a live financial dashboard. Use pink headers to highlight primary budget categories and cyan headers for comparative metrics. Update figures in real-time during presentations to demonstrate budget tracking and variance analysis.
-
Recommended For
CFOs, financial controllers, project managers, and development leads presenting budget status to executives, investors, and project sponsors. Particularly effective for IT project finance reviews, app development cost justification, and service launch budget presentations.
-
Slide Structure
Two-slide deck with 3-row × 4-column table layout per slide. Header row (pink or cyan) contains category labels; rows 2–3 provide data entry fields. Left side includes descriptive text; right side displays the table for balanced information delivery and numerical emphasis.
Related Products
-

Simple & Modern Wide PPT Mockup for Business Insights
#Market and Competitor Analysis #Financial Plans and Performance #Diagram
-

Rhombus Presentation Template Table Chart – Optimized for Financial Planning and Performance
#Financial Plans and Performance #Diagram #Budget
-

Love and Data Charts – Visualizing Financial Performance
#Financial Plans and Performance #Diagram #Budget
-

Red Purple Highlight Table – An Ideal Choice for Financial Planning
#Financial Plans and Performance #Diagram #Budget
