Stylish Design for Professional Presentation Visualization – Effective Diagram Template
RJ0400007_11
- Last Update 05/18/2025
- File Size 0.6MB
- # of Slides 2
- File Format PPTX
- Slide Ratio 16:9
- Color
Keywords
About the Product
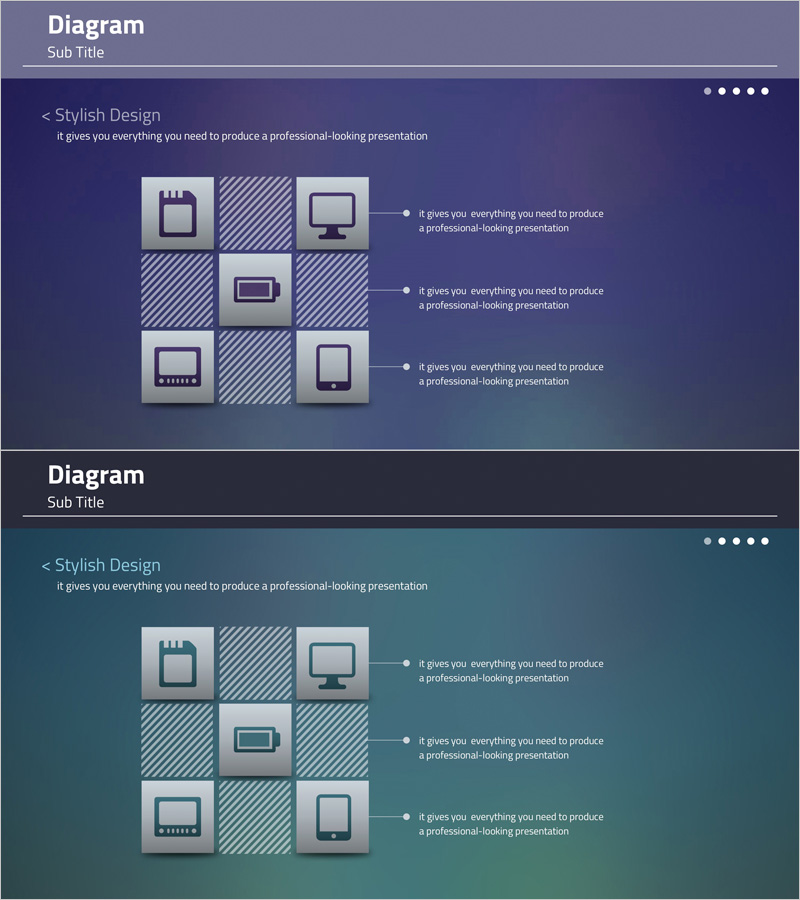
A 3×3 grid-based diagram PowerPoint slide designed to visually explain IT service and system architecture. The slide features a dark blue background with gray and white icons (storage, network, monitor, mobile, server) arranged in a grid pattern, with three text description areas on the right connected by lines. Provided in 2-slide format with color variations (dark blue and dark green) optimized for 16:9 widescreen presentations. Ideal for technology presentations, system proposals, and investor pitches to clearly communicate service architecture, system composition, and technology stack.
Usage Points
-
Main Usage
This slide is designed to present IT service and system architecture at a glance. The 3×3 grid layout accommodates up to 9 elements (storage, network, monitor, mobile, server, etc.), with three key items highlighted on the right via connecting lines. It effectively communicates both technical credibility and system structure clarity.
-
How to Use
Insert this slide into the 'Service Architecture' or 'Technology Stack' section of technical presentations, proposals, or investor decks. Edit the icons and text areas to match your service, explaining system composition, infrastructure structure, or technology architecture. Choose between two color variations (dark blue or dark green) to align with your document's visual identity.
-
Recommended For
Perfect for IT, software, and cloud companies presenting technical solutions, system integration (SI) proposals, startup investor pitches, and technology partnership presentations. CTOs, technical leaders, and solution architects use this slide when explaining system architecture to technical decision-makers, investors, and partners.
-
Slide Structure
The slide set consists of 2 slides maintaining the same 3×3 grid layout. Each slide features a 9-cell grid on the left with 9 icons, and three text description areas on the right connected by dotted lines. Color variations (dark blue and dark green) enable section differentiation within your document.
Related Products
-

System Connection Diagram – Sophistication in Operational Planning Tools
#Operational Plan #Technical Approach #Diagram
-

Camping Isometric Project Service Operation Plan
#Technical Approach #Diagram #Service Operation Plan
-

Mobile Messenger Mockup Design – Customer Success Case
#Technical Approach #Customer Success Stories #Text Box
-

Food App Diagram – Business Vision and Strategy
#Business Vision and Strategy #Technical Approach #Diagram
