Global Network World Map Slide – Explore with Blue and Green
RJ0400003_18
- Last Update 05/17/2025
- File Size 4.3MB
- # of Slides 2
- File Format PPTX
- Slide Ratio 16:9
- Color
Keywords
- #Content-Based Slides
- #Design-Based Slides
- #Company Introduction
- #Graph
- #Other
- #Global Network
- #Customers and Partners
- #Circles
- #Doughnut Chart
- #Map
- #16:9
- #world map PowerPoint slide
- #global network presentation
- #regional data visualization
- #world map slide template
- #international business presentation
About the Product
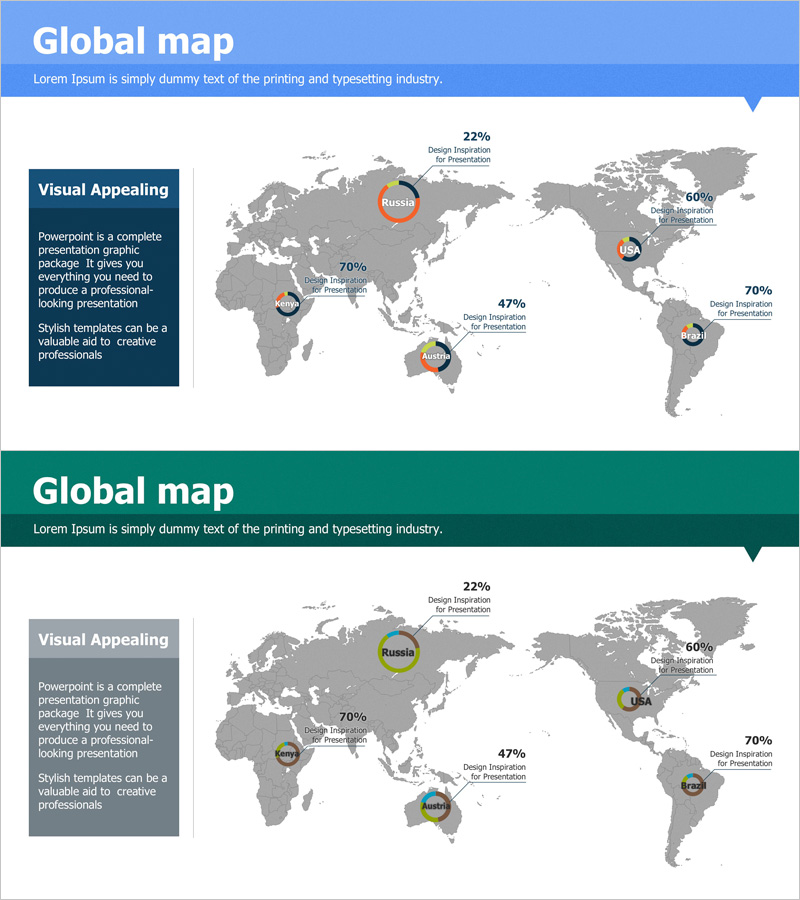
A professional world map PowerPoint slide designed to showcase global business performance across five key regions. The template features a gray-toned world map with highlighted regions (Russia, North America, Africa, Australia, South America) and corresponding data points (22%, 60%, 47%, 70%) represented through circular charts and text labels. The blue and green header design conveys trust and professionalism, with two color variants to match your presentation theme. Delivered in 16:9 PPTX format for immediate editing and customization.
Usage Points
-
Main Usage
Visualize international market performance, regional sales figures, global network distribution, and overseas business results using map-based representation. Circular charts enable intuitive regional data comparison and percentage analysis.
-
How to Use
Double-click region names, percentages, and charts to replace with your own data. Select the header color (blue or green) matching your corporate brand or presentation theme. Add descriptive text in the text box to provide context and enhance audience understanding.
-
Recommended For
Ideal for international marketing presentations, overseas sales reports, global strategy meetings, investor briefings, regional performance reviews, and business expansion plans. Suitable for executives, sales teams, marketing departments, and management consultants.
-
Slide Structure
Two-slide template. Each slide features a gray-toned world map with five regions marked by circular chart icons and percentage data. A dark-colored text box (blue or green) on the left accommodates title and description text. All region names, percentages, and chart elements are fully editable.
Related Products
-

Country-by-country Status Analysis Map Template
#Company Introduction #Graph #Other
-

Identity Wide Template – Visualizing Global Network
#Company Introduction #Text Box #Other
-

World Map and Learning Content Icon – Visualization of Global Network
#Company Introduction #Other #Global Network
-

Map of Asia and a Brief Analysis – Introduction to Global Network
#Company Introduction #Other #Global Network
