Diagram Visualizing Cosmetic Development Project List
RJ0400002_4
- Last Update 05/17/2025
- File Size 2.5MB
- # of Slides 2
- File Format PPTX
- Slide Ratio 16:9
- Color
Keywords
About the Product
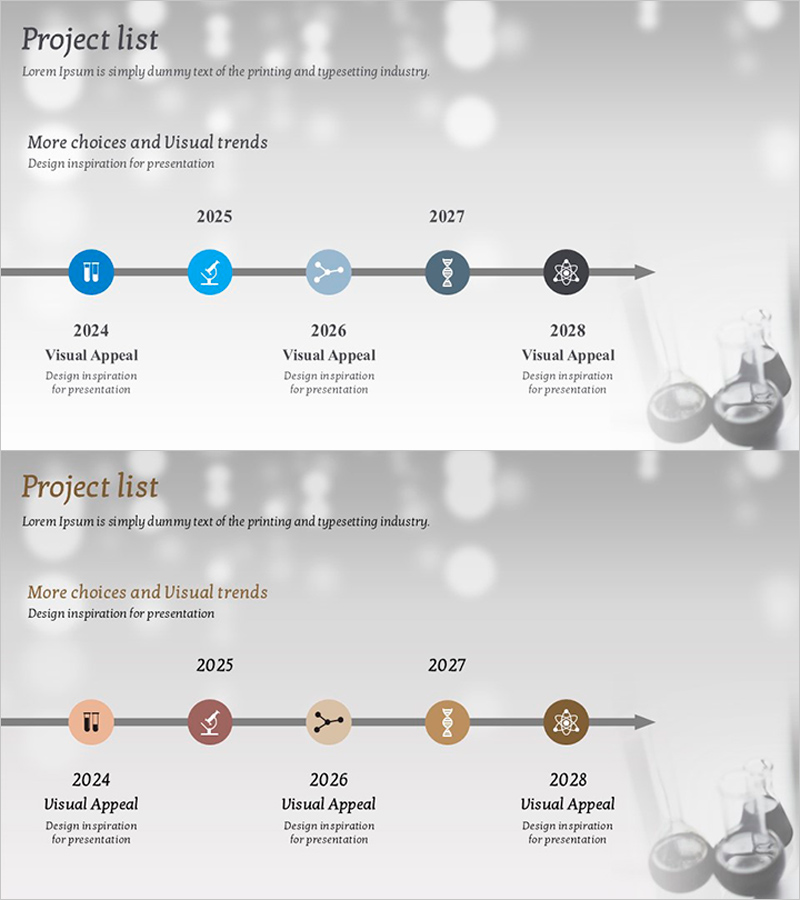
A linear timeline diagram PowerPoint slide that visualizes the year-by-year progress of a cosmetic development project from 2024 to 2028. Five milestone stages are represented using circular nodes connected by a directional arrow, with customizable icons and text descriptions for each phase. The design employs a gradient color scheme in blue, gray, and black tones to clearly convey the sequential flow of the project. Comprising 2 slides optimized for 16:9 widescreen format, this template is ready for immediate use in presentations.
Usage Points
-
Main Usage
This diagram clearly expresses the sequential progression of a project over time, with milestones aligned from 2024 to 2028. It enables audiences to grasp the project schedule and objectives at a glance through visual representation.
-
How to Use
Use this template in business plans, project proposals, annual goal presentations, and product development roadmaps to explain time-based progression stages. Customize the icons and text in each node to match your project's specific characteristics and create a tailored timeline.
-
Recommended For
Project managers, product development teams, marketing planners, and executives presenting mid-term plans (3–5 years) will find this template valuable. It is particularly effective in industries with phased development processes such as cosmetics, pharmaceuticals, IT, and manufacturing.
-
Slide Structure
Composed of 2 slides, each featuring a horizontal linear timeline as the central element. Five circular nodes are connected in a single line with a directional arrow, with icons positioned above each node and year labels with descriptive text below. The light gray background enhances the color contrast of the nodes.
Related Products
-

Internet Security Platform Structure Diagram – Stability and Innovation
#Business Strategy #Technical Approach #Diagram
-

Building a Information Framework – Effective Operations Plan
#Operational Plan #Technical Approach #Diagram
-

Startup Investment Funding Plan Table – Blueprint Preparation
#Financial Plans and Performance #Diagram #Capital Requirements
-

PowerPoint Template for Service Operation Strategy Presentation
#Business Management #Operational Plan #Technical Approach
