March Promotion Schedule – A Clear Roadmap for Project Management
RJ0300097_22
- Last Update 05/16/2025
- File Size 0.5MB
- # of Slides 2
- File Format PPTX
- Slide Ratio 16:9
- Color
Keywords
- #Content-Based Slides
- #Design-Based Slides
- #Business Strategy
- #Business Management
- #Diagram
- #Roadmap
- #Implementation Schedule
- #Cluster
- #Table
- #Closed Cluster Diagram
- #16:9
- #Gantt chart PowerPoint slide
- #project timeline template
- #schedule planning presentation
- #monthly schedule diagram
- #project management PPT download
About the Product
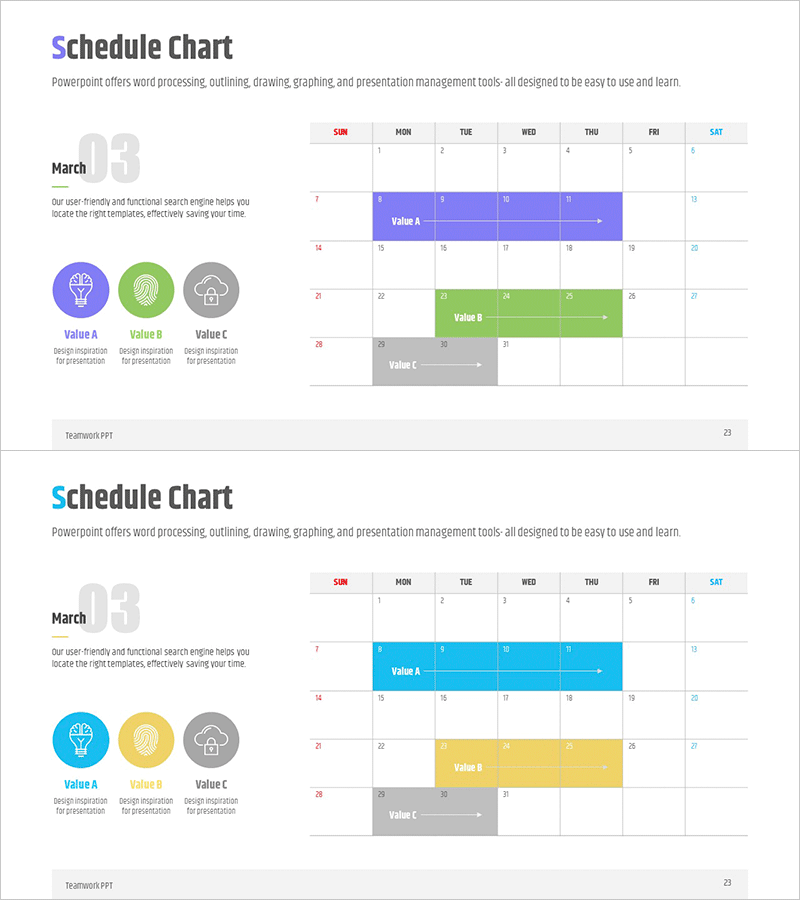
A Gantt chart-style PowerPoint slide that visualizes March project schedules across three parallel tasks. Three color-coded items (Value A in blue, Value B in green, Value C in gray) are positioned horizontally across a weekly calendar grid, enabling clear timeline representation. Each task displays start date, end date, and duration at a glance, making it ideal for project management presentations and business reports. The 16:9 widescreen format includes 2 slides in PPTX, with fully editable text, colors, and date ranges for customization.
Usage Points
-
Main Usage
Visualize monthly project schedules using a Gantt chart format to communicate project timelines clearly. Color-coded bars for each task show start and end dates, allowing stakeholders to understand concurrent workflows and task sequencing at a glance.
-
How to Use
Use in business plans, quarterly project reports, project kickoff presentations, and team meetings. The calendar grid background with horizontal task bars enables intuitive representation of schedule conflicts, parallel execution, and sequential dependencies.
-
Recommended For
Project managers, business strategists, marketing directors, and planning teams presenting monthly or quarterly schedules to executives and team members. Effective for organizations managing multiple concurrent projects requiring timeline coordination.
-
Slide Structure
2-slide set. Each slide features a March calendar grid (Sunday–Saturday headers, dates 1–31) with three color-coded horizontal bars: Value A (blue), Value B (green), and Value C (gray). Each bar spans from start to end date with directional arrows indicating task progression.
Related Products
-

Business Promotion Schedule Roadmap – Strategy and Management
#Business Strategy #Business Management #Diagram
-

Dawn City Theme Roadmap – Business Strategy
#Business Strategy #Business Management #Diagram
-

Data Analysis Schedule – Table for Business Strategy
#Business Strategy #Business Management #Diagram
-

Key Events Roadmap – Business Strategy and Diagram Utilization
#Business Strategy #Business Management #Diagram
