Business Performance Visualization Infographic Slide – Key to Success
RJ0300076_31
- Last Update 05/10/2025
- File Size 0.1MB
- # of Slides 2
- File Format PPTX
- Slide Ratio 16:9
- Color
Keywords
About the Product
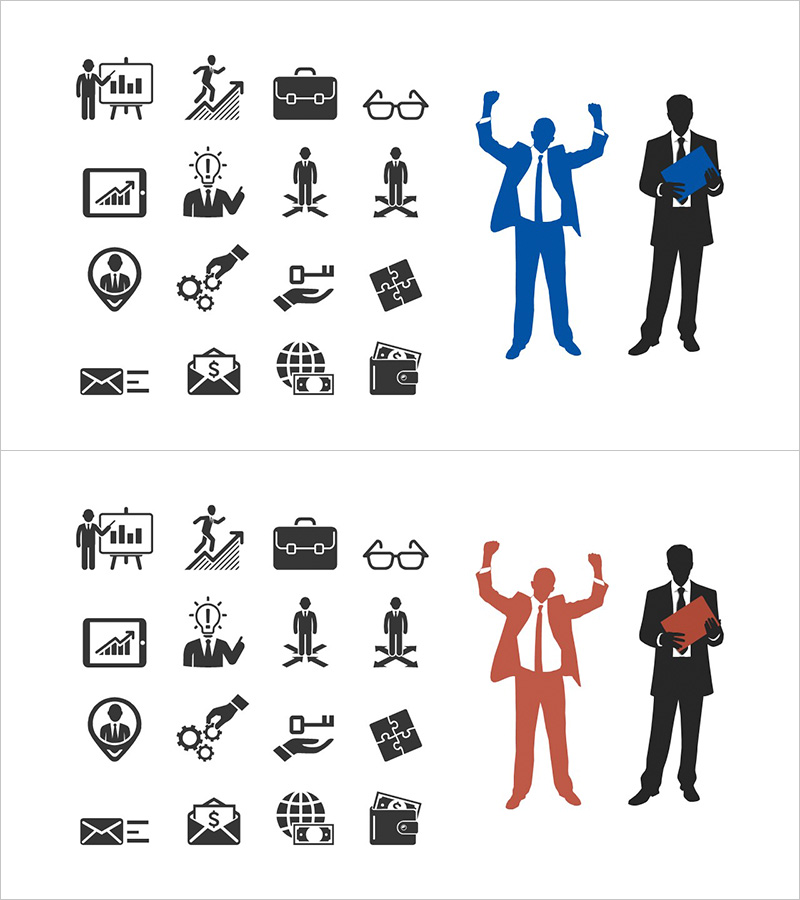
A business performance visualization PowerPoint slide featuring 16 business icons and two human silhouettes representing success scenarios. The slide includes essential business icons (charts, meetings, strategy, success, finance) arranged in a grid layout on the left, with two figure silhouettes on the right—one in blue celebrating victory and one in black holding a briefcase. The dual-tone background (blue and red) allows you to express both positive achievements and challenge situations simultaneously. Delivered as a 2-slide deck in 16:9 widescreen format (PPTX), ready for immediate use in data visualization and success case presentations.
Usage Points
-
Main Usage
Communicate business performance, success cases, and data insights visually through icon-based infographics. The 16 icons represent core business elements (charts, meetings, strategy, finance, success), while the dual-tone background (blue for achievement, red for challenge) conveys both positive outcomes and improvement journeys simultaneously.
-
How to Use
Use this slide as a background for business performance presentations, quarterly results reports, or success case sharing. Apply the blue slide to emphasize positive achievements and the red slide to discuss challenges and improvement strategies. Add arrows, numbers, or highlight boxes over icons to emphasize specific business elements or metrics.
-
Recommended For
Executive reports, quarterly performance presentations, business consulting proposals, investor pitch decks (IR materials), marketing performance analysis, organizational achievement sharing meetings. Ideal for executives, marketing teams, and strategy teams who need to communicate quantitative results alongside qualitative messaging.
-
Slide Structure
2-slide deck with each slide featuring 16 business icons arranged in a grid layout on the left side and two human silhouettes on the right—one in blue (victory pose) and one in black (holding briefcase). The icon area represents key business elements (charts, meetings, strategy, success, finance), while the figures reinforce emotional messaging. Optimized for 16:9 widescreen format for modern presentation environments.


