Cluster Diagram Visualizing Business Key Objectives
RJ0300055_7
- Last Update 05/03/2025
- File Size 0.9MB
- # of Slides 2
- File Format PPTX
- Slide Ratio 16:9
- Color
Keywords
- #Content-Based Slides
- #Design-Based Slides
- #Business Vision and Strategy
- #Marketing Plan and Strategy
- #Diagram
- #Business Goals
- #Marketing Objectives
- #Cluster
- #Closed Cluster Diagram
- #16:9
- #cluster diagram PowerPoint
- #business objectives presentation
- #strategy slide template
- #marketing plan diagram
- #goal visualization PPT
- #closed-form diagram PowerPoint
About the Product
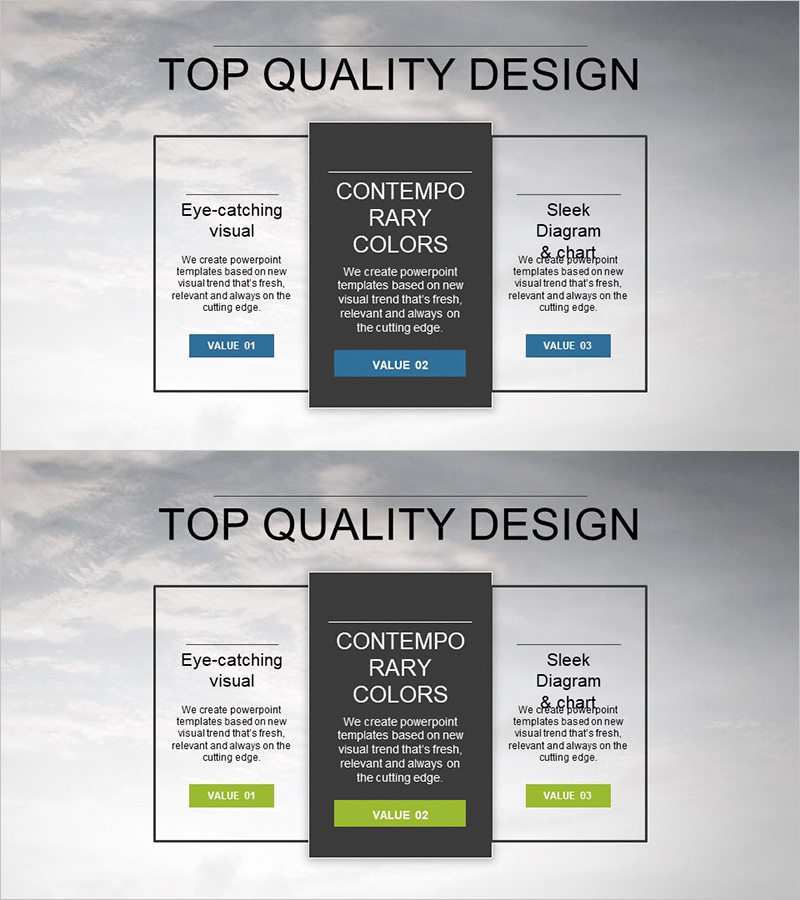
A cluster diagram PowerPoint slide that visualizes business key objectives and strategies through three central axes. The closed-form structure radiates from the core concept at the center to upper-left and upper-right positions, clearly expressing relationships between interconnected goals. Set against a dark gray background with white-bordered boxes and blue accent buttons for information hierarchy, this 16:9 two-slide deck is ready for immediate use in presentations and marketing plans. Each area accommodates flexible text and description input, making it ideal for business strategy, marketing planning, organizational objectives, and various corporate presentations.
Usage Points
-
Main Usage
Optimized for expressing organizational core objectives alongside their connected detailed strategies simultaneously. The three-directional radial structure from the central concept enables instant comprehension of goal relationships and priorities, while the closed-box arrangement clearly delineates information boundaries.
-
How to Use
Input business objectives, marketing strategies, and operational plans into each box area to construct the organization's complete objective framework. Following the radial flow from center to sides during presentation helps audiences easily understand goal interconnections. Colors and text are fully editable.
-
Recommended For
Recommended for business plans, marketing strategies, strategic planning presentations, organizational goal-sharing meetings, investor briefings, and executive reports. Particularly valuable for executives, marketing professionals, and strategic planning teams who need to organize multiple objectives hierarchically.
-
Slide Structure
Two-slide composition where each slide features a central dark gray box (core concept input area) and two white-bordered boxes in upper-left and upper-right positions (detailed objective input areas). Blue accent buttons (VALUE 01–03) positioned below each box visually represent information priority.
Related Products
-

Setting Goals for Business Growth – Vision and Marketing Strategy
#Business Vision and Strategy #Marketing Plan and Strategy #Diagram
-

Fintech Business Goals Diagram – Implementing Marketing Strategy
#Business Vision and Strategy #Marketing Plan and Strategy #Diagram
-

Mobile App Service Goals – Effective Business Strategy
#Business Vision and Strategy #Marketing Plan and Strategy #Diagram
-

Setting Successful Business Goals Slide – Target Setting and Achievement
#Business Vision and Strategy #Marketing Plan and Strategy #Diagram
