Green Yellow SWOT Analysis Diagram – Essential Tool for Market Analysis
RJ0300051_16
- Last Update 05/02/2025
- File Size 3.1MB
- # of Slides 2
- File Format PPTX
- Slide Ratio 16:9
- Color
Keywords
About the Product
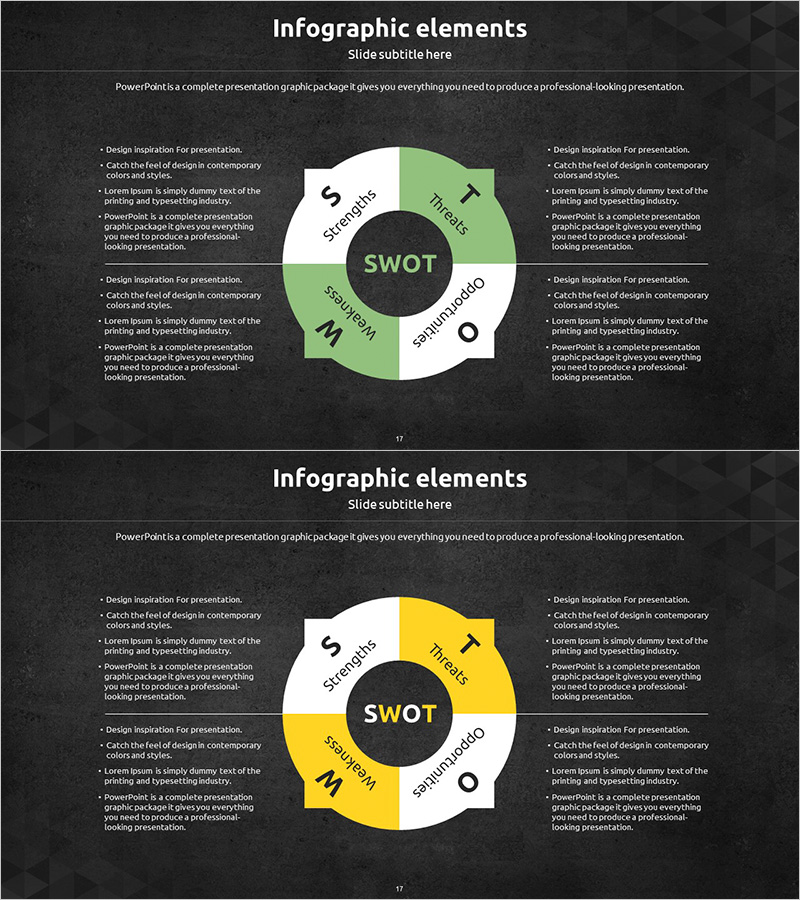
An essential SWOT analysis PowerPoint slide for market analysis and competitive assessment. The dark background features a four-quadrant diagram highlighted in green and yellow tones, enabling clear comparison of Strengths, Weaknesses, Opportunities, and Threats at a glance. Text input areas are positioned on both left and right sides, allowing detailed descriptions for each quadrant. This layout works seamlessly in both presentations and reports. The 2-slide set includes color variations (green-emphasized and yellow-emphasized versions) so you can match your document's tone and presentation flow.
Usage Points
-
Main Usage
A strategic analysis tool that systematically visualizes a company's strengths and weaknesses alongside market opportunities and threats. Supports executive reporting, investor presentations, and business planning by providing data-driven insights for strategic decision-making.
-
How to Use
Enter analysis content into the four text boxes corresponding to each quadrant (S, W, O, T), then add detailed explanations in the left and right description areas. Use the two color variations to emphasize different sections or select the version that best matches your presentation flow.
-
Recommended For
Strategy and business planning managers, marketing planning teams, executive reporting specialists, investment pitch presenters, and consulting project teams conducting market analysis and competitive strategy development.
-
Slide Structure
Each slide features a central circular SWOT diagram with four distinct quadrants and text input areas on both sides. The layout includes a title section at the top, a central four-quadrant diagram with color-coded sections, and four text boxes (one per quadrant) for detailed explanations with clear information hierarchy.
Related Products
-

SWOT Analysis Diffusion Diagram – Effective Market Analysis Tool
#Market and Competitor Analysis #Diagram #SWOT Analysis
-

Circle SWOT Analysis Diagram – Enhance Market Analysis
#Market and Competitor Analysis #Diagram #SWOT Analysis
-

SWOT Analysis Circular Slice Diagram – Market and Competitor Analysis
#Market and Competitor Analysis #Diagram #SWOT Analysis
-

SWOT Analysis Square Diagram – A Useful Template for Market Analysis
#Market and Competitor Analysis #Diagram #SWOT Analysis
