Market Analysis Bundle Vertical Bar Graph
RJ0300048_6
- Last Update 05/01/2025
- File Size 6.2MB
- # of Slides 2
- File Format PPTX
- Slide Ratio 16:9
- Color
Keywords
- #Content-Based Slides
- #Design-Based Slides
- #Business Strategy
- #Business Management
- #Diagram
- #Step-by-Step Schedule Plan
- #Implementation Plan
- #Cluster
- #Chain Diagram
- #16:9
- #vertical bar chart PowerPoint
- #market analysis presentation slide
- #data comparison chart
- #business graph template
- #how to create bar chart in PowerPoint
About the Product
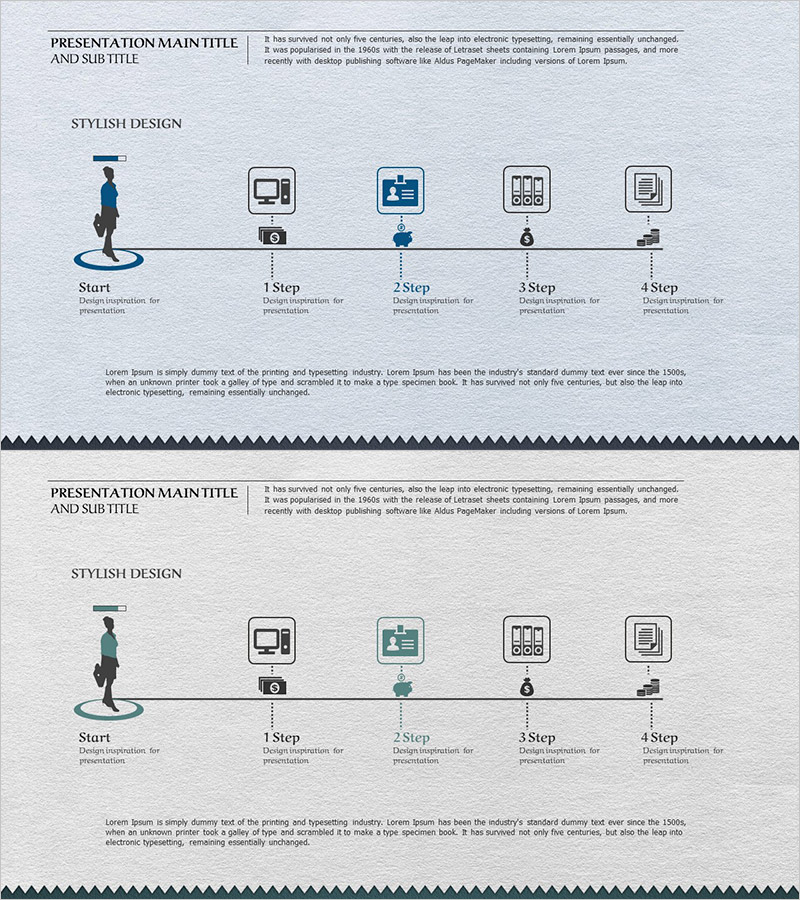
A vertical bar chart PowerPoint slide optimized for market analysis and data comparison. This presentation template features five comparable data items, ideal for visualizing sales volume, market share, customer satisfaction, and other business metrics. The consistent navy blue color palette reinforces professionalism, while numeric labels above each bar ensure precise data communication. The two-slide set allows you to present multiple datasets simultaneously, and the 16:9 widescreen format adapts seamlessly to modern presentation environments. Fully editable and ready for immediate use in business reports and investor presentations.
Usage Points
-
Main Usage
This slide presents quantitative data for market analysis, competitive comparison, and sales performance in a clear comparative format. The five-item structure enables simultaneous presentation of relative differences, making it ideal for executive briefings, investor presentations, and marketing strategy discussions where data-driven credibility is essential.
-
How to Use
Adjust each bar height to match your actual data values and update the legend and axis labels for immediate use. Maintain the color scheme while highlighting key items with accent colors, or reposition data labels to improve readability. Stack the two slides sequentially to show time-series or regional comparisons.
-
Recommended For
Recommended for finance teams presenting quarterly results, marketing teams sharing market research findings, sales teams analyzing regional or product performance, executives reporting business status, and investor presentations. Particularly effective in decision-making contexts requiring quantitative evidence.
-
Slide Structure
Two-slide set, each featuring a vertical bar chart with five data items. Navy blue bars display white numeric labels, with item names and legend positioned at the bottom. The 16:9 widescreen format includes left-side space for title and descriptive text.
Related Products
-

Camping Procedures and Directions Linear Diagram – Step-by-Step Execution Strategy
#Business Strategy #Business Management #Diagram
-

Phase-Based Execution Flow Diagram – Visualizing Business Strategy
#Business Strategy #Business Management #Diagram
-

Conveyor Arrow Process Diagram
#Business Strategy #Business Management #Diagram
-

Schedule Planning Speech Bubble Diagram – Business Strategy and Connection Design
#Business Strategy #Business Management #Diagram
