U.S. Target Region Distribution – Market Analysis
RJ0300044_21
- Last Update 04/29/2025
- File Size 0.3MB
- # of Slides 2
- File Format PPTX
- Slide Ratio 16:9
- Color
Keywords
- #Content-Based Slides
- #Design-Based Slides
- #Market and Competitor Analysis
- #Marketing Plan and Strategy
- #Graph
- #Other
- #Target Market
- #Target Market Strategy
- #Other
- #Radar Chart Spider Chart
- #Map
- #16:9
- #U.S. map PowerPoint slide
- #regional distribution presentation
- #target market map
- #United States geography slide template
- #market analysis map template
- #how to create regional map in PowerPoint
About the Product
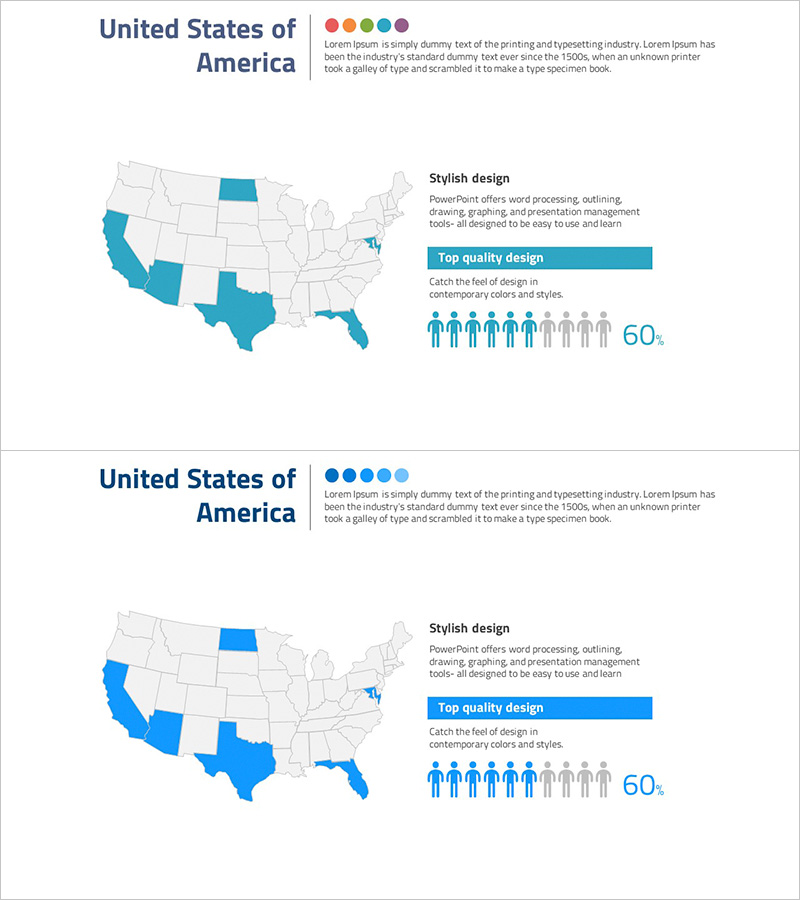
A PowerPoint slide featuring a U.S. map with five states (California, Texas, Florida, Arizona, Montana) highlighted in teal to visualize target market distribution. The 2-slide set includes a version with five multicolored accent dots (red, orange, green, blue, purple) at the top, and a second version with all dots unified in blue. Each slide incorporates a 'Stylish design' header, 'Top quality design' emphasis box, and infographic elements (10-person icon with 60% fill indicator) for immediate use in marketing strategy presentations, market analysis reports, and regional business planning decks. Delivered in 16:9 widescreen PPTX format, fully editable in all PowerPoint versions.
Usage Points
-
Main Usage
Visualize target market distribution across the United States geographically to communicate marketing strategy, sales territory analysis, and business expansion plans with clarity. The highlighted states on the map enable instant recognition, making regional priorities and strategic focus areas immediately apparent to stakeholders.
-
How to Use
Open the slide and modify the highlighted colors on the U.S. map to match your target regions, then update the accent dots and infographic percentages with your actual data. Insert into the market analysis section of marketing plans, regional strategy slides in investor pitch decks, or regional performance analysis pages in sales reports.
-
Recommended For
Marketing managers, sales strategy planners, regional business development managers, investor relations executives, market research analysts, and business leaders planning U.S. regional expansion. Ideal for B2B and B2C companies presenting market strategies targeting the United States.
-
Slide Structure
2-slide set with the first slide displaying a U.S. map (gray background) with five states highlighted in teal, and five multicolored accent dots (red, orange, green, blue, purple) arranged at the top. The second slide maintains the same map layout with all accent dots unified in blue. Both slides include a 'Stylish design' text label on the right, a 'Top quality design' emphasis box, and an infographic showing 10 person icons with 6 filled (60% indicator).
Related Products
-

European Target Country Analysis Graph – Strategic Market Insights
#Market and Competitor Analysis #Marketing Plan and Strategy #Graph
-

Target Market Strategy Map – Visual Tool for Market Analysis
#Market and Competitor Analysis #Marketing Plan and Strategy #Other
-

Effective Slide Design for Analysis of Specific Regions in the U.S.
#Market and Competitor Analysis #Marketing Plan and Strategy #Other
-

Map of Major Target Areas in the United States – Market Analysis and Marketing Strategy
#Market and Competitor Analysis #Marketing Plan and Strategy #Other
