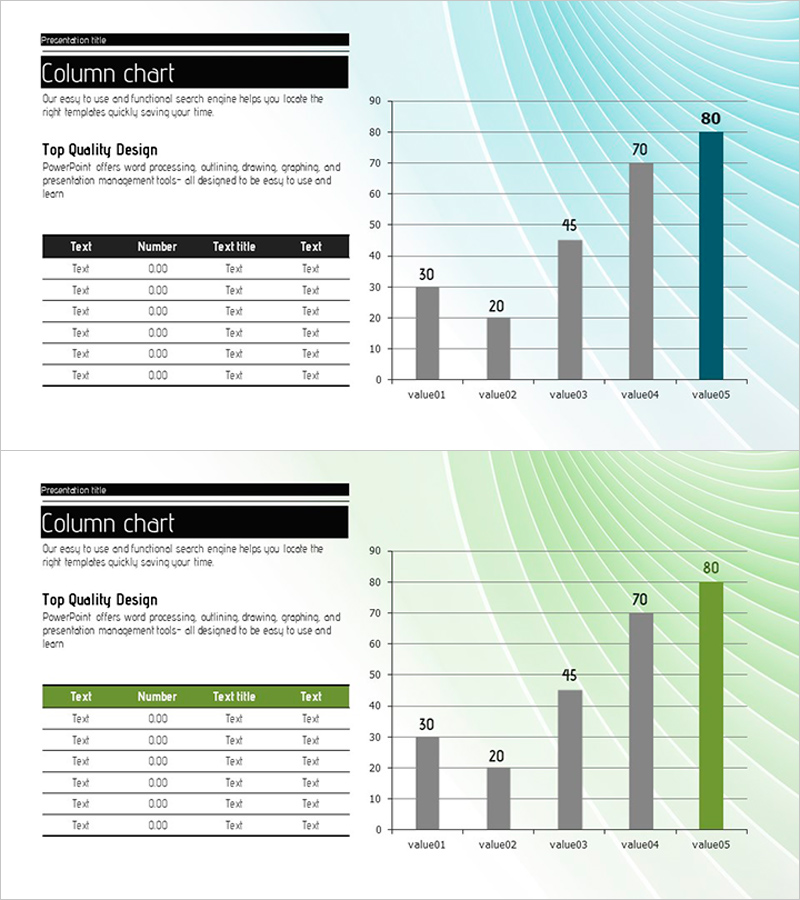
Financial Plans and Performance
Color-highlighted Bar Graphs and Tables – Optimized for Financial Analysis
RJ0200012_6
- Last Update 12/21/2025
- File Size 1.3MB
- # of Slides 2
- File Format PPTX
- Slide Ratio 16:9
- Color
Keywords
About the Product
This slide utilizes color-highlighted bar graphs and table designs to effectively visualize sales and performance. The harmonious blend of teal and green enhances information clarity while reinforcing visual impact. It is particularly useful for showcasing financial planning and performance and is ideal for investment return analysis materials. Inputting detailed data and numbers is straightforward, and text replacement is easy, with an overall editing difficulty rated as 'easy'. It can be quickly applied to internal reports or corporate presentation materials.
Related Products
-
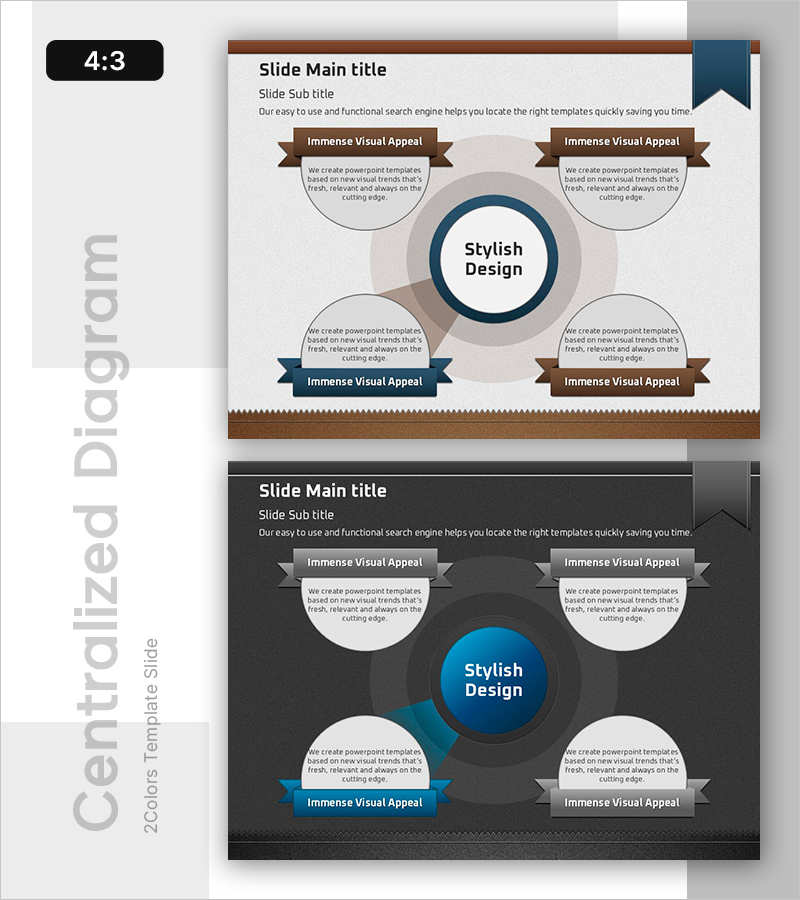
Diffusion of Ideas and Areas of Focus – Centralized Cluster Diagram
#Product/Service #Business Vision and Strategy #Diagram
-
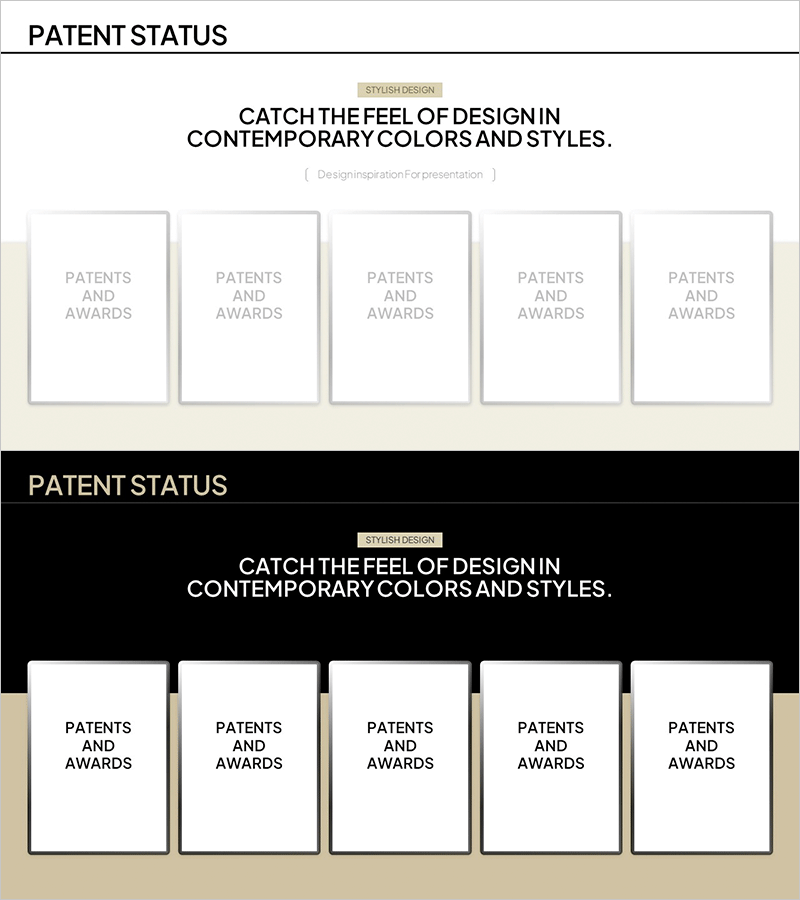
Introduction of Major Awards – Innovation and Achievement
#Company Introduction #Diagram #Awards and Certifications, and Patents
-
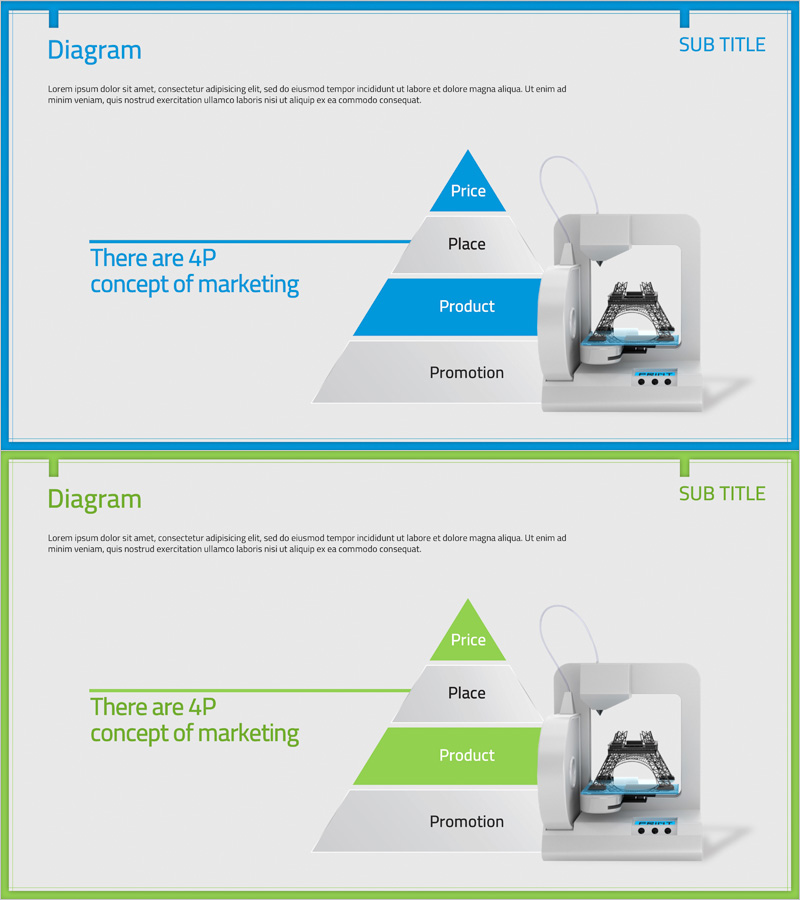
3D Printing Business Marketing Strategy Visualizing 4P
#Marketing Plan and Strategy #Diagram #Marketing Objectives
-
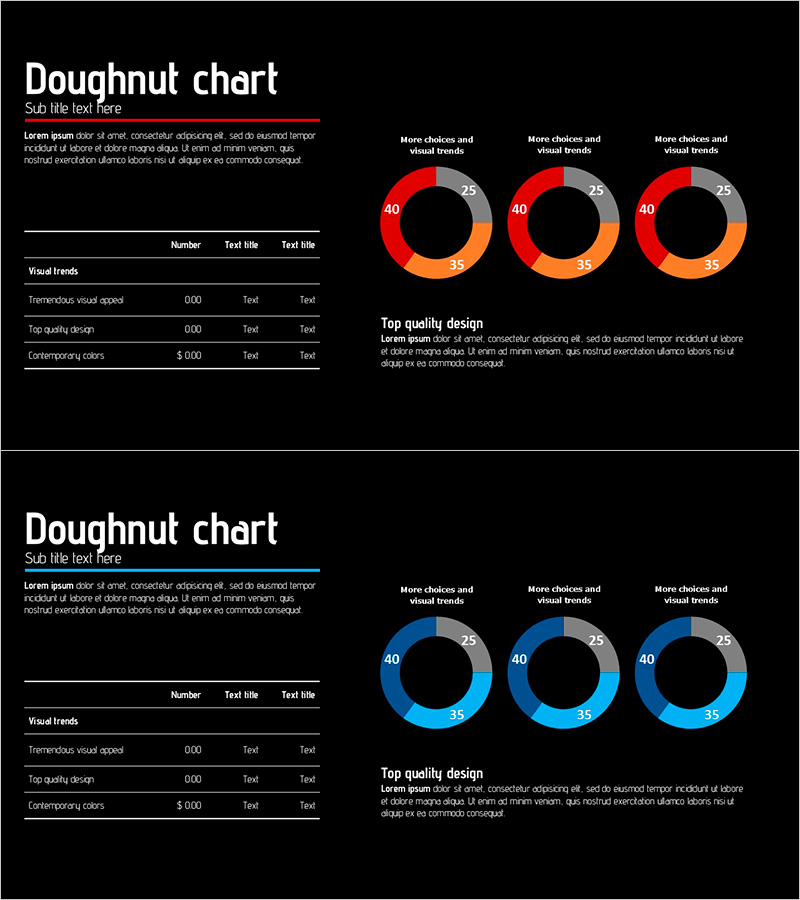
Visualizing Competitive Analysis with Table and 3 Donut Graphs
#Market and Competitor Analysis #Diagram #Graph
