Technology Sector
Cluster Diagram Slide Visualizing Relationships Between Connected Items
RB0800019_7
- Last Update 12/21/2025
- File Size 2.5MB
- # of Slides 2
- File Format PPTX
- Slide Ratio 4:3
- Color
Keywords
About the Product
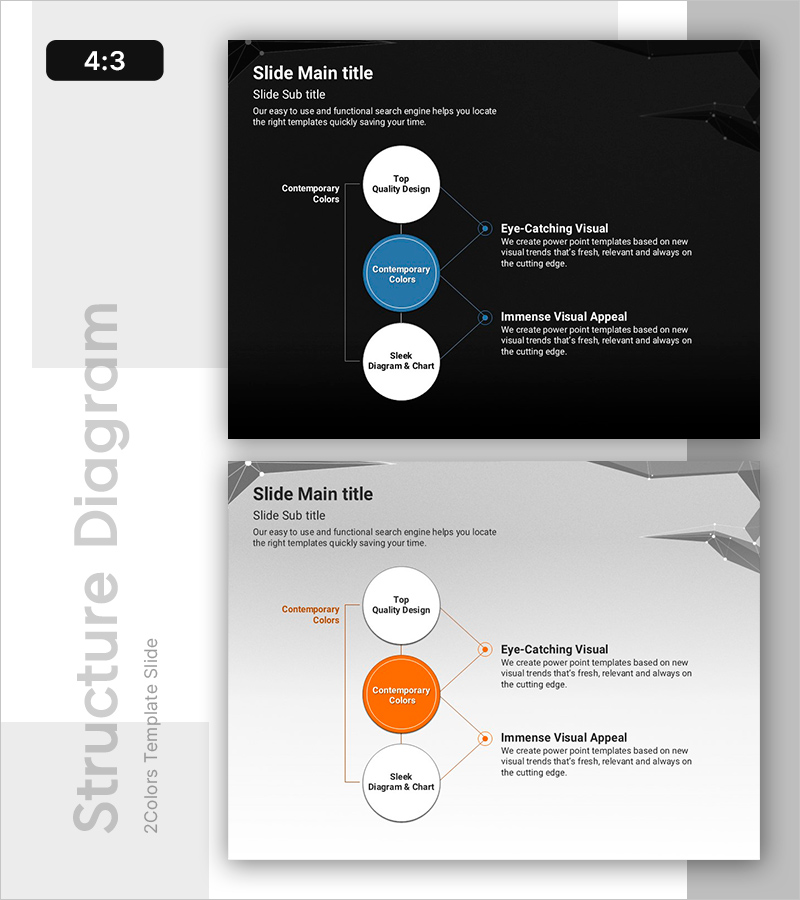
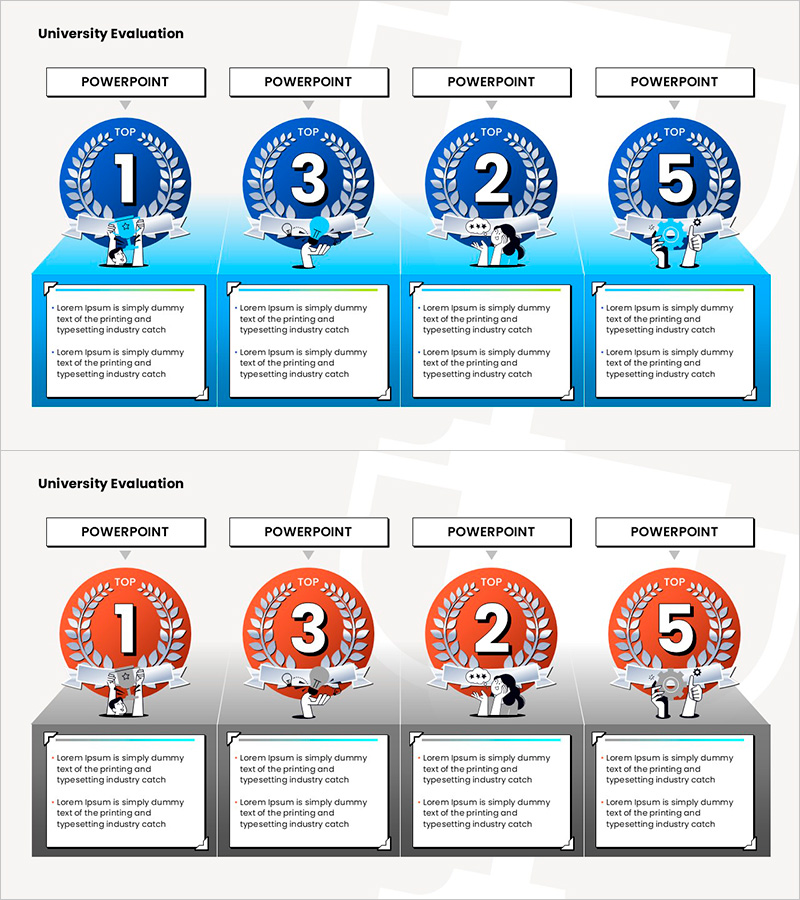
This slide utilizes a cluster diagram to visualize the relationships between connected items. With a simple yet contemporary design, the slide features blue and orange as primary colors to enhance visual appeal. It is particularly suitable for the technology sector and discussions on service establishment or innovative technology and future planning. Users can convey complex information clearly and effectively through this slide. The editing difficulty is rated as 'easy', allowing quick replacement of text and graph elements for immediate use in various presentations.
Related Products
-
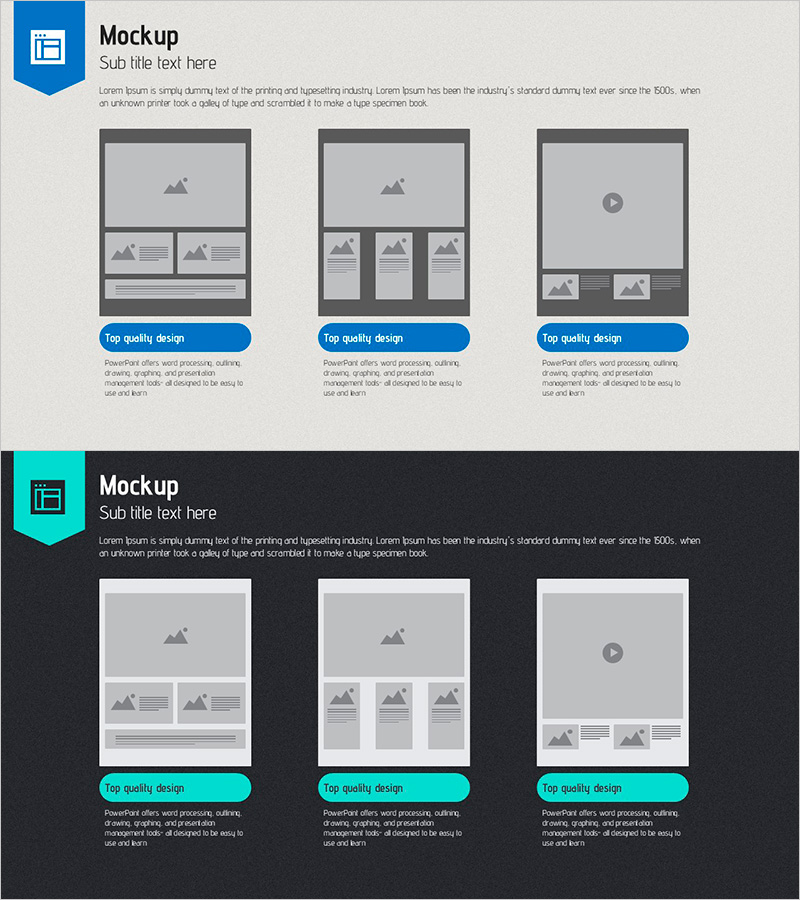
Online Presentation Template Mockup – Visualizing Marketing Strategies
#Slide Type #Marketing Plan and Strategy #Diagram
-
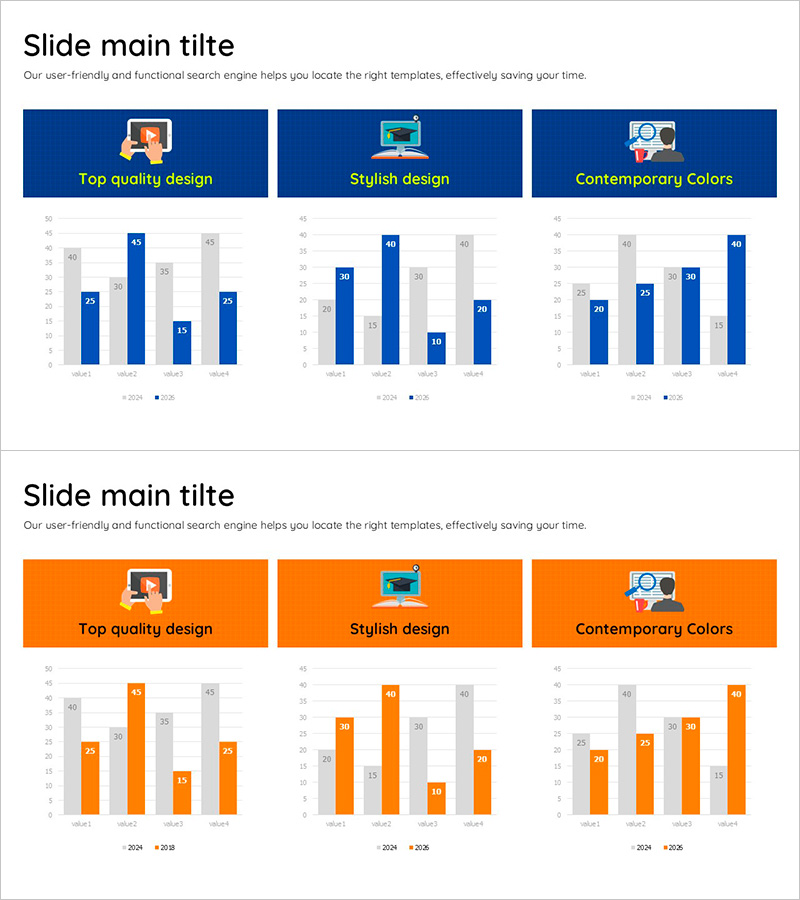
Analysis of Online Learning Data Slide
#Market and Competitor Analysis #Diagram #Graph
-
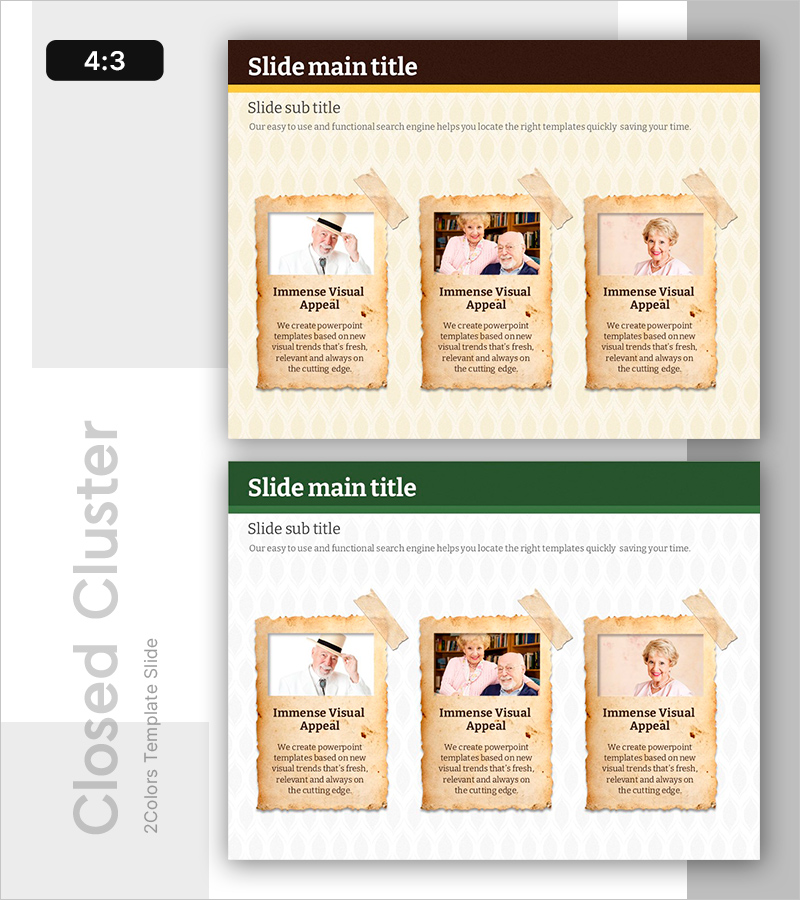
Characteristics of Older Customers Slide – Insights and Success Cases
#Market and Competitor Analysis #Customer Success Stories #Diagram
-
Introducing the Distinctive Strengths of Our University – University Evaluation Diagram
#Product/Service #Business Promotion Strategy #Diagram
