Financial Plans and Performance
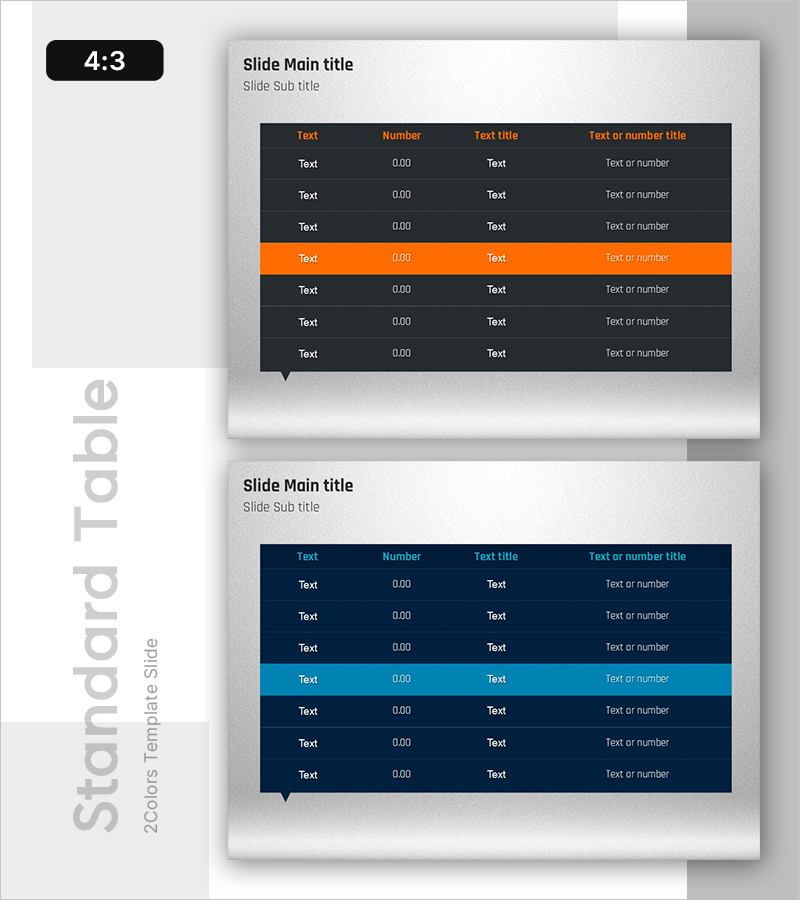
Visualizing Financial Performance with Standard Table Slide
RB0800008-1_15
- Last Update 12/21/2025
- File Size 2.1MB
- # of Slides 2
- File Format PPTX
- Slide Ratio 4:3
- Color
Keywords
About the Product
This slide features a standard table that neatly organizes key financial indicators in a diagram format. With a harmonious blend of orange and blue, it presents information clearly and attractively. It enables rapid analysis of financial plans, helping to effectively communicate anticipated revenue, expenses, and asset statuses. It is ideal for clearly understanding the financial health of a company during meetings with executives or investors. The data set is easy to edit, and the overall editing difficulty is rated as easy.
Related Products
-
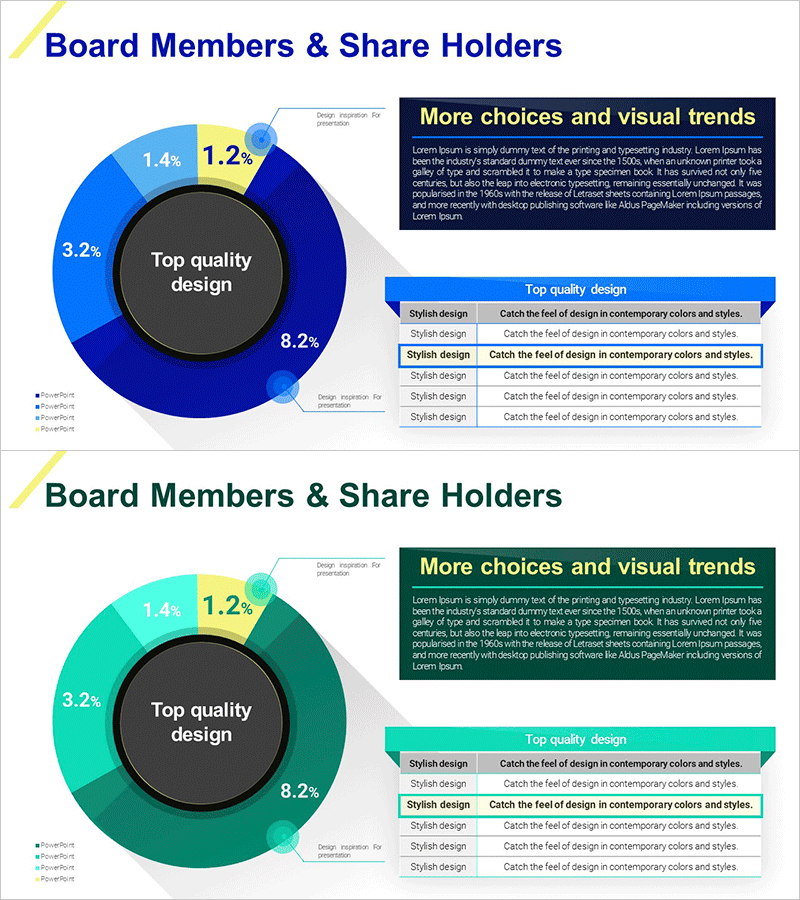
Detailed Analysis of Shareholder Status Donut Chart
#Company Introduction #Market and Competitor Analysis #Diagram
-

Flow Diagram for Traditional Cultural Industry System
#Technology Sector #Diagram #System Configuration
-
Marketing Strategy Visualization with Trend Scrap Illustration
#Marketing Plan and Strategy #Diagram #Promotion Strategy
-

Representative Ingredients Slide for Business Insights
#Company Introduction #Business Introduction #Diagram
