Technology Sector
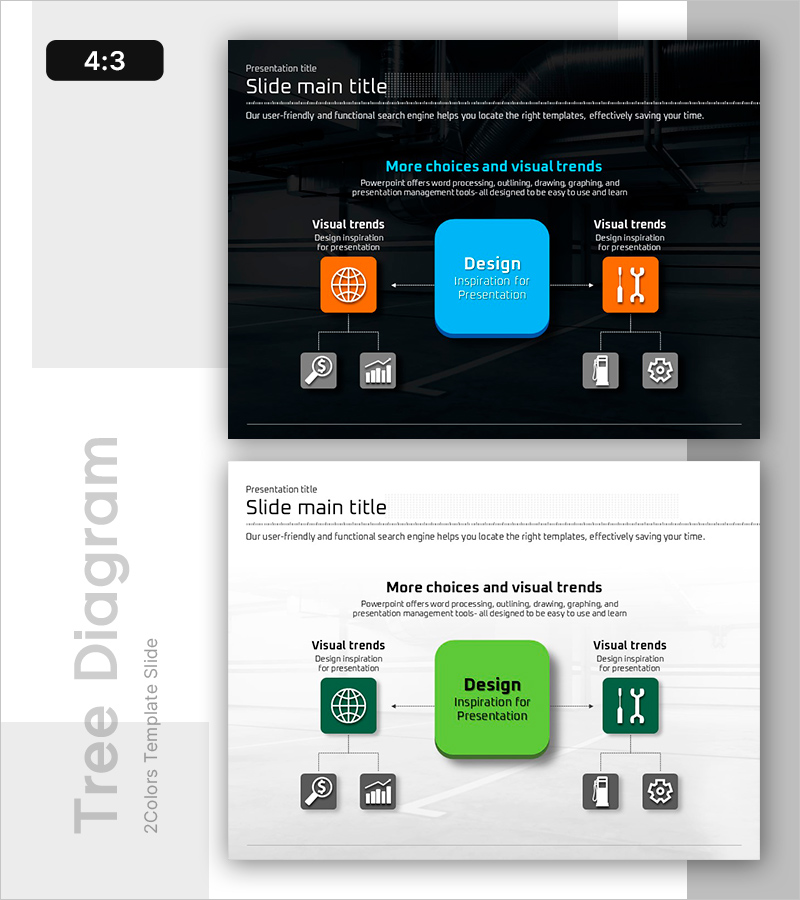
Auto Business Ops Diagram – Efficiency and Innovation
RB0700027_4
- Last Update 12/21/2025
- File Size 2MB
- # of Slides 2
- File Format PPTX
- Slide Ratio 4:3
- Color
Keywords
About the Product
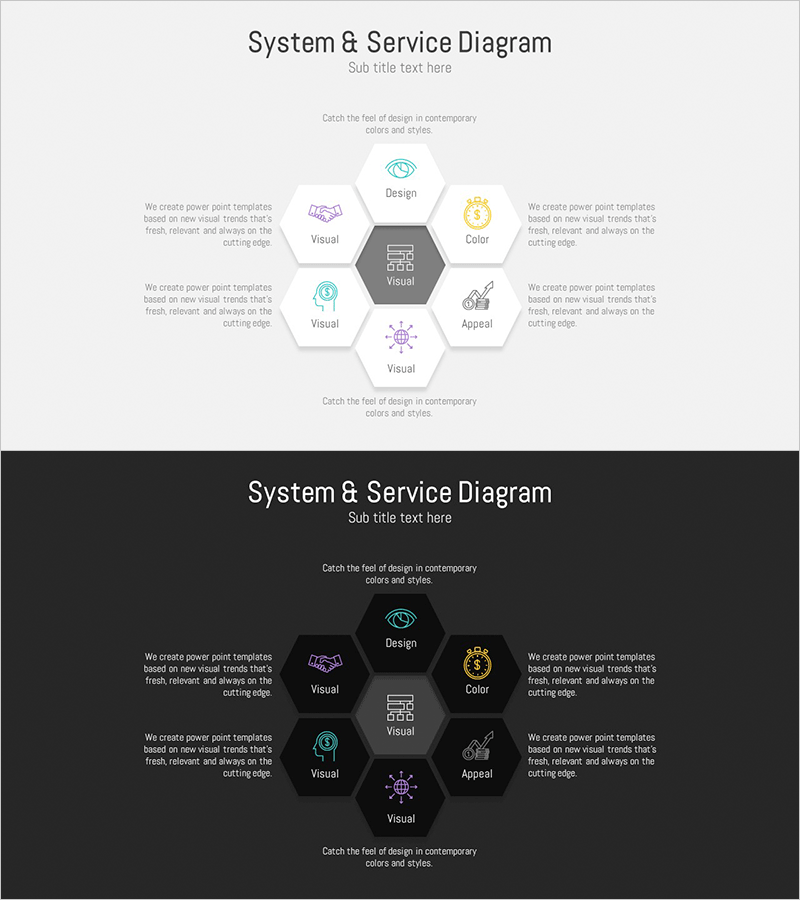
This slide visually represents the operations system of the auto industry. The harmonious blend of blue and green colors emphasizes technical aspects, making complex systems easy to understand. It's ideal for illustrating technical sectors or service configurations, helping simplify corporate operational strategies. This diagram can effectively convey complex information in reports or proposals to clients.
Related Products
-
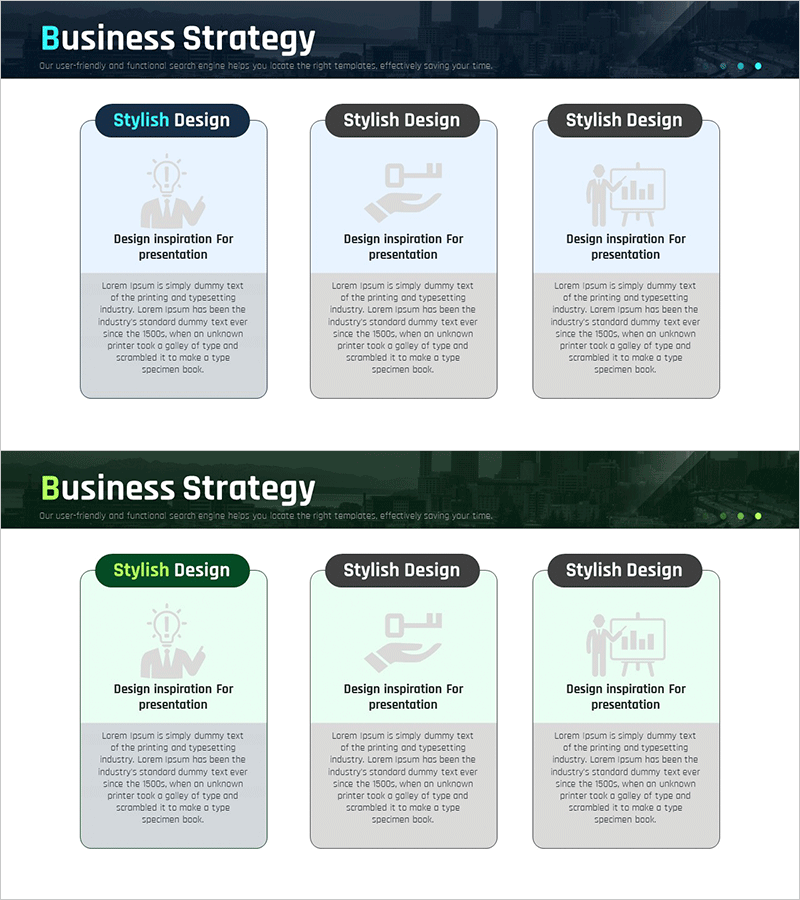
Key Strategies to Enhance Corporate Competitiveness – Design for Success
#Product/Service #Diagram #Product/Service Introduction
-
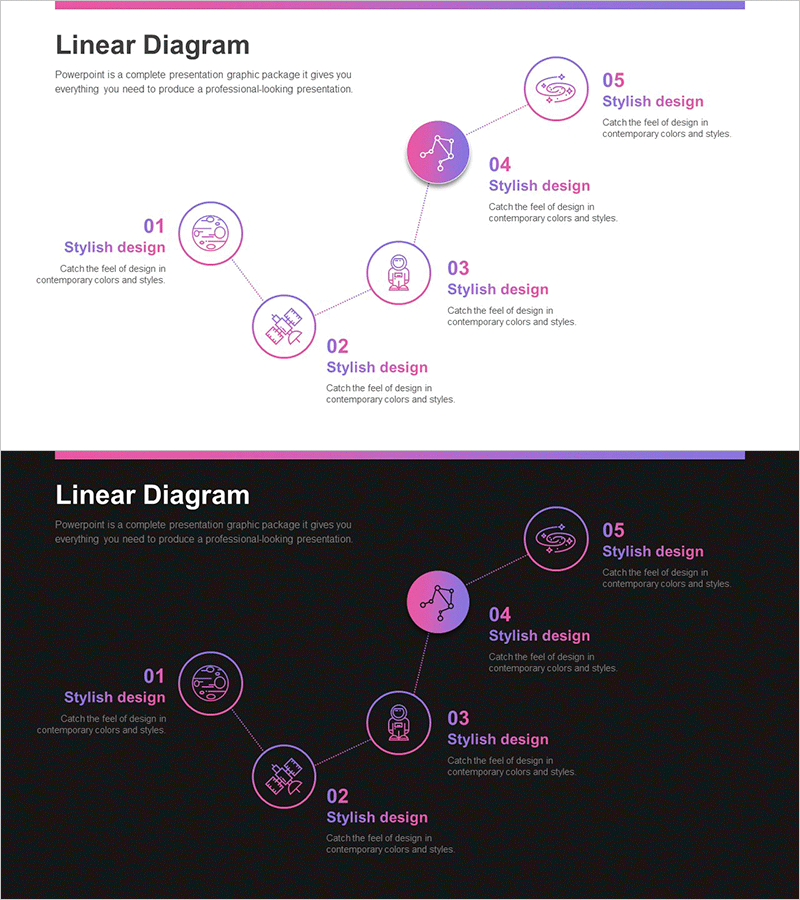
Astronomy Research Step-by-Step Schedule – Systematic Implementation Strategy
#Business Promotion Strategy #Business Management #Diagram
-
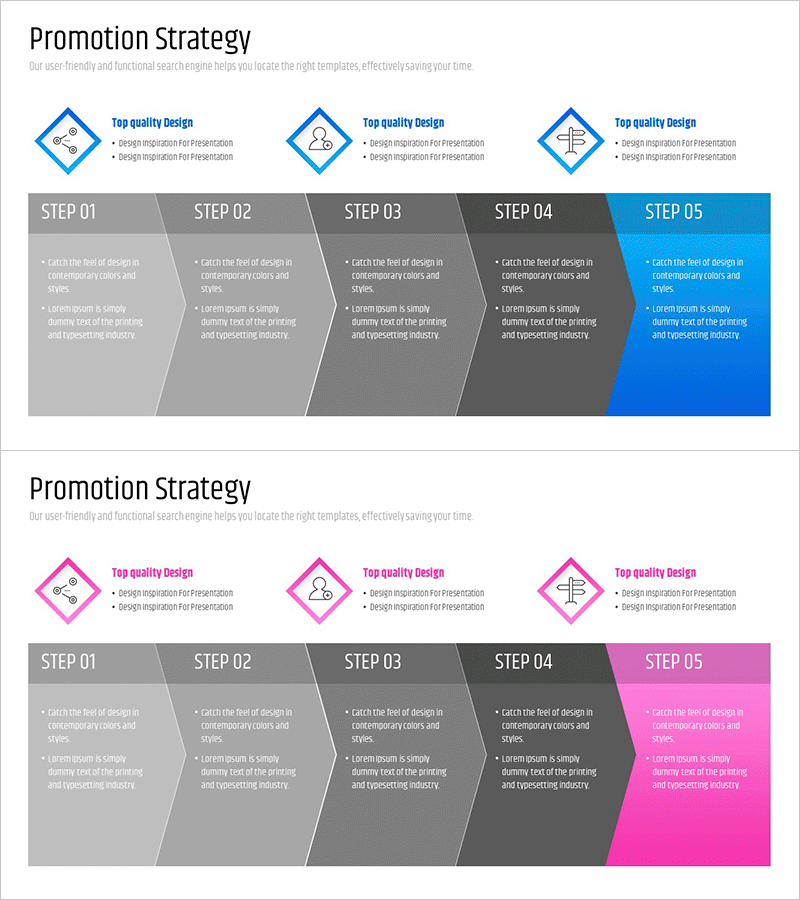
Promotion Strategy Diagram – Business Vision and Marketing Plan
#Business Vision and Strategy #Marketing Plan and Strategy #Diagram
-
Hexagon Business Area Diagram – Visualizing Service Composition
#Company Introduction #Technology Sector #Diagram
