Company Introduction
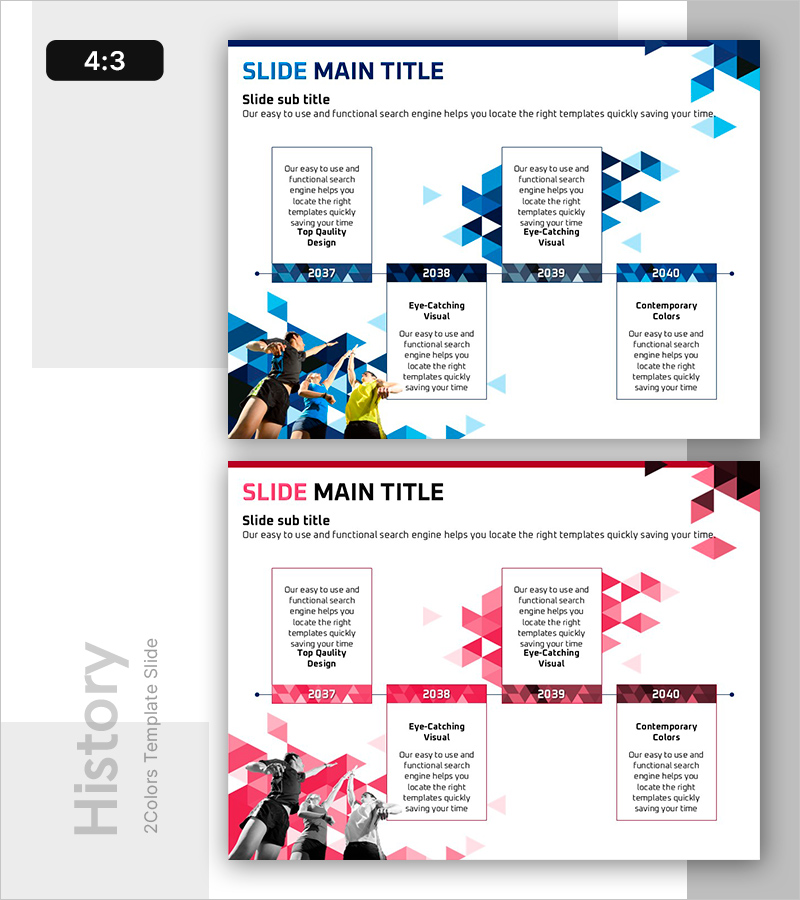
Visualizing Trends in Aerobic Training – Timeline Diagram
RB0600014_4
- Last Update 12/21/2025
- File Size 0.8MB
- # of Slides 2
- File Format PPTX
- Slide Ratio 4:3
- Color
Keywords
About the Product
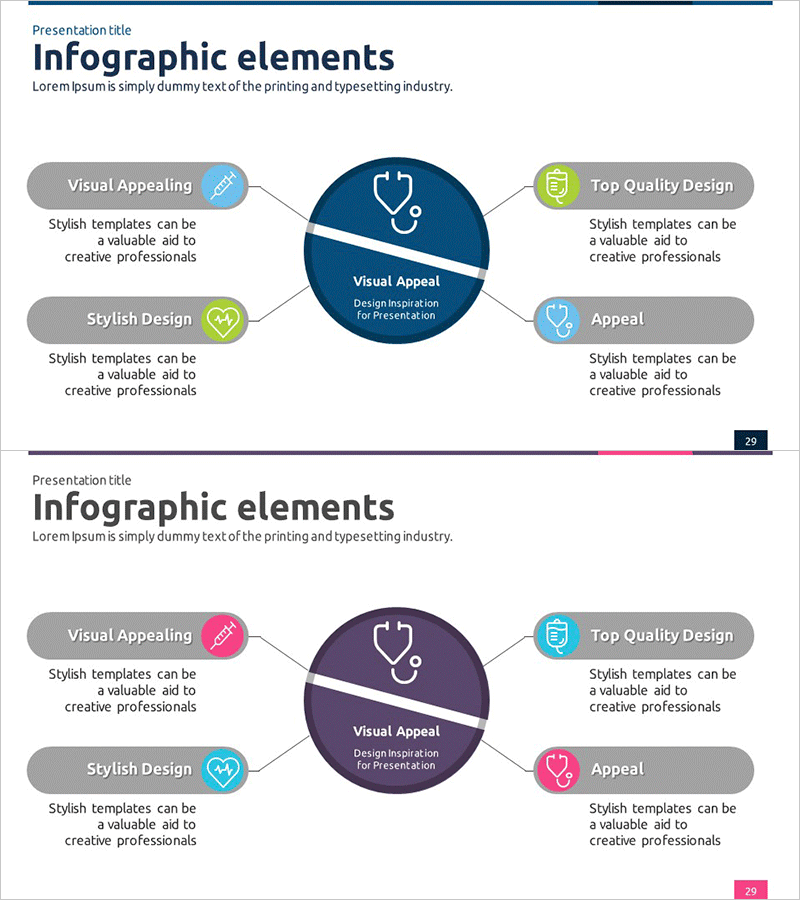
This slide effectively visualizes the trends in aerobic training through a cluster diagram format. Each year's changes and key achievements are clearly organized for systematic communication. The contrast between blue and red enhances readability and distinguishes the title area from the year-by-year explanation area. Ideal for company overviews, historical presentations, and project achievement discussions, this slide can be utilized for strategic business conversations. Text and graph replacement is straightforward, with an overall ease of editing rated as 'easy', allowing quick integration into various presentations.
Related Products
-
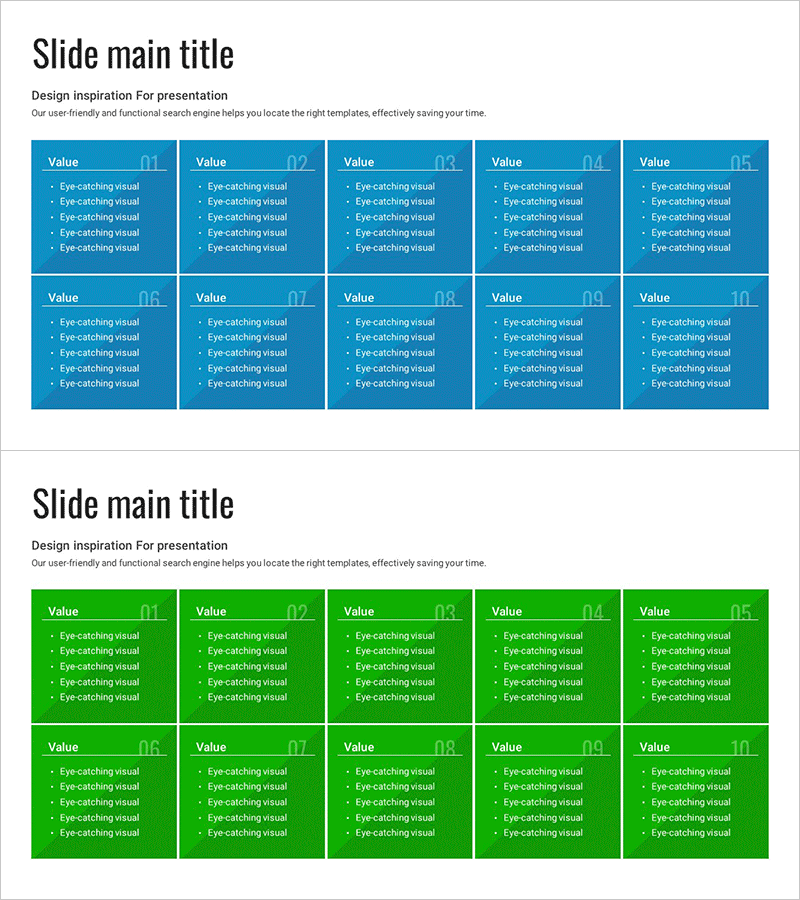
Business Overview Square Closed Diagram for Effective Presentation
#Product/Service #Business Introduction #Business Vision and Strategy
-
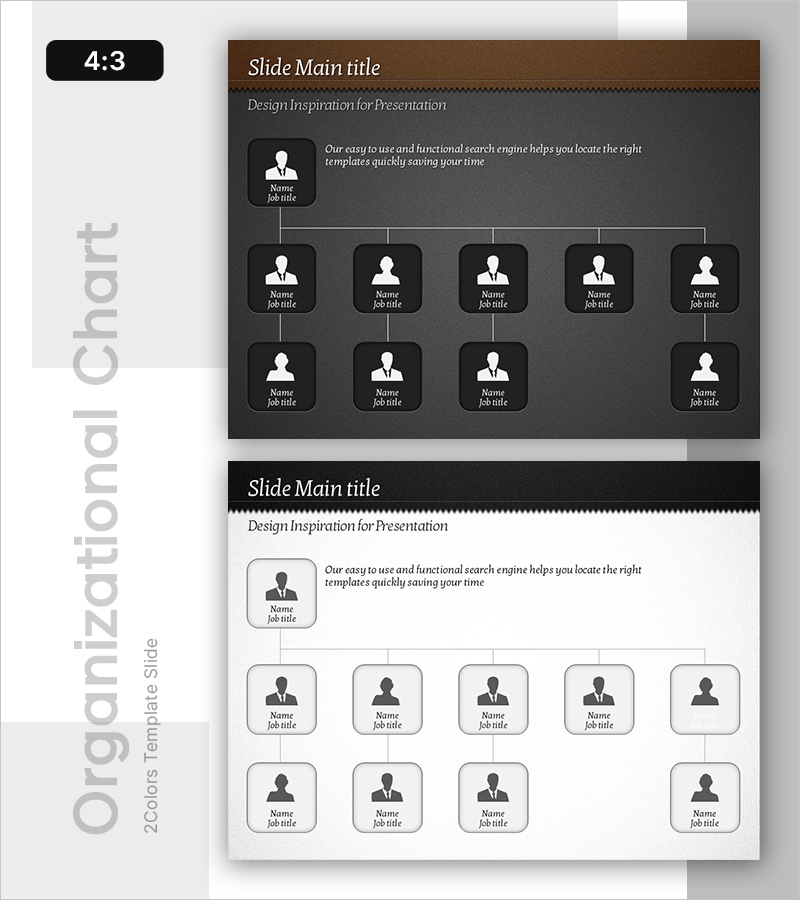
Leather PowerPoint Organization Chart – Visualize Your Company Structure
#Company Introduction #Diagram #Organizational Chart
-
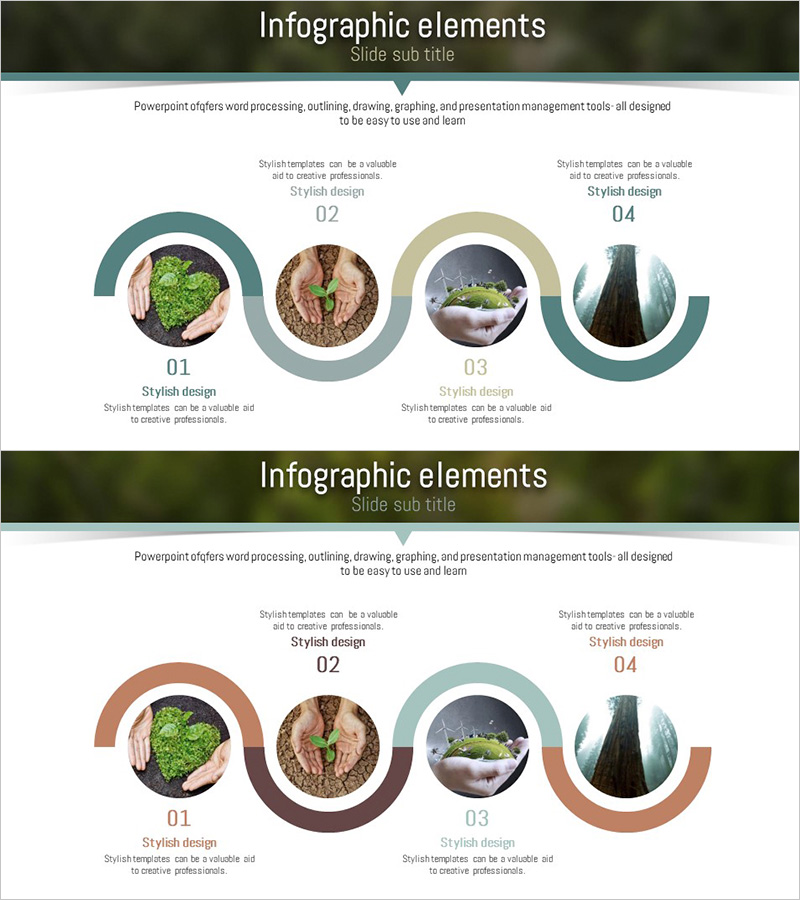
Eco-friendly Process Connected Diagram – Marketing Strategy
#Business Promotion Strategy #Marketing Plan and Strategy #Diagram
-
Medical Business Sector Diffusion Diagram - Clarifying Business Structure
#Company Introduction #Business Introduction #Diagram
