Business Promotion Strategy
Graphical Analysis of Drug Component Responses – Innovative Data Visualization
RB0400015_5
- Last Update 12/21/2025
- File Size 3MB
- # of Slides 2
- File Format PPTX
- Slide Ratio 4:3
- Color
Keywords
About the Product
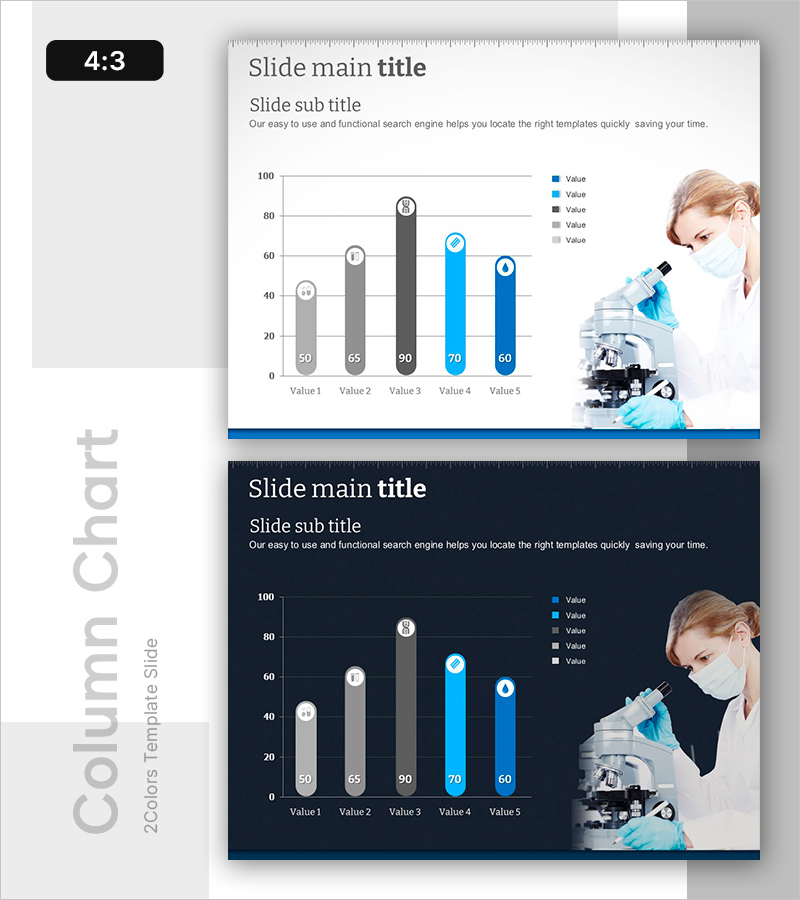
This slide presents a vertical bar graph visually analyzing the responses of drug components. It excels in data comparison and offers clear color contrast for easy differentiation of responses. Designed to effectively communicate achievements in the tech sector and business strategies, it emphasizes a scientific and innovative approach suitable for research findings and presentations. The presentation template allows for easy editing with straightforward replacements of text and graphic elements, making it user-friendly. Ideal users include researchers, corporate strategists, and educators, providing key insights through effective communication.
Related Products
-
Wide Graph Presentation with Triangle Pattern
#Market and Competitor Analysis #Marketing Plan and Strategy #Graph
-
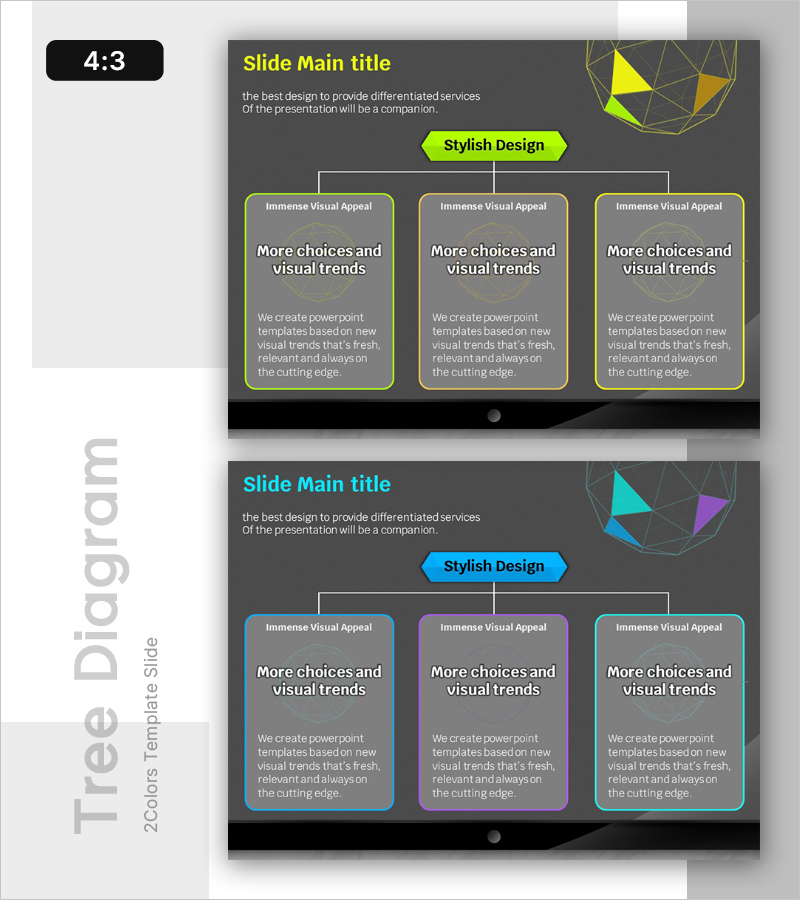
Hierarchical Network Structure Tree – Supporting Innovation Technology
#Operation Plan #Technology Sector #Diagram
-
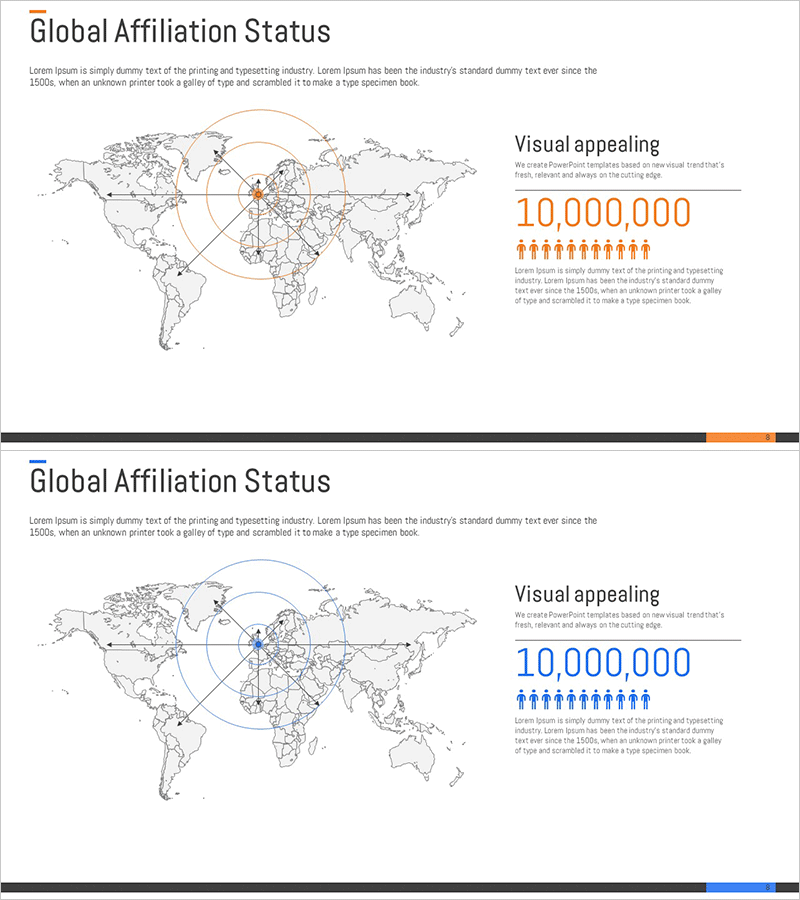
Global Customer Market Analysis Slide – Market and Competitor Analysis
#Market and Competitor Analysis #Graph #Other
-

Visualizing Market Situation with Donut Chart – Collaboration and Challenge
#Market and Competitor Analysis #Graph #Market Status
