Market and Competitor Analysis
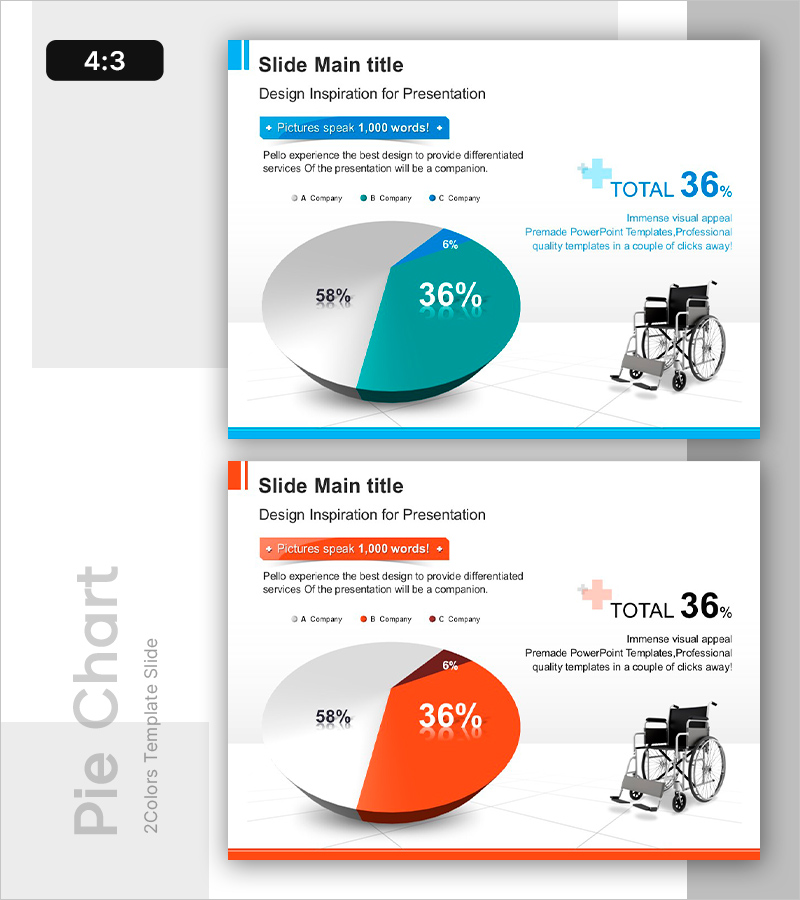
Patient Satisfaction Survey Results Pie Chart Slide – Market Status Analysis
RB0400010_6
- Last Update 12/21/2025
- File Size 0.3MB
- # of Slides 2
- File Format PPTX
- Slide Ratio 4:3
- Color
Keywords
About the Product
This slide utilizes a pie chart to visually represent the satisfaction rates of various companies based on patient surveys. The combination of green, blue, and red colors provides intuitive data visualization, clearly distinguishing the proportions of each company (A, B, C). This slide is greatly suitable for market and competitive analysis, as well as effectively conveying customer survey results. Text and graph elements are easy to replace, with an editing difficulty rated as 'easy', allowing for quick integration into various presentation materials.
Related Products
-
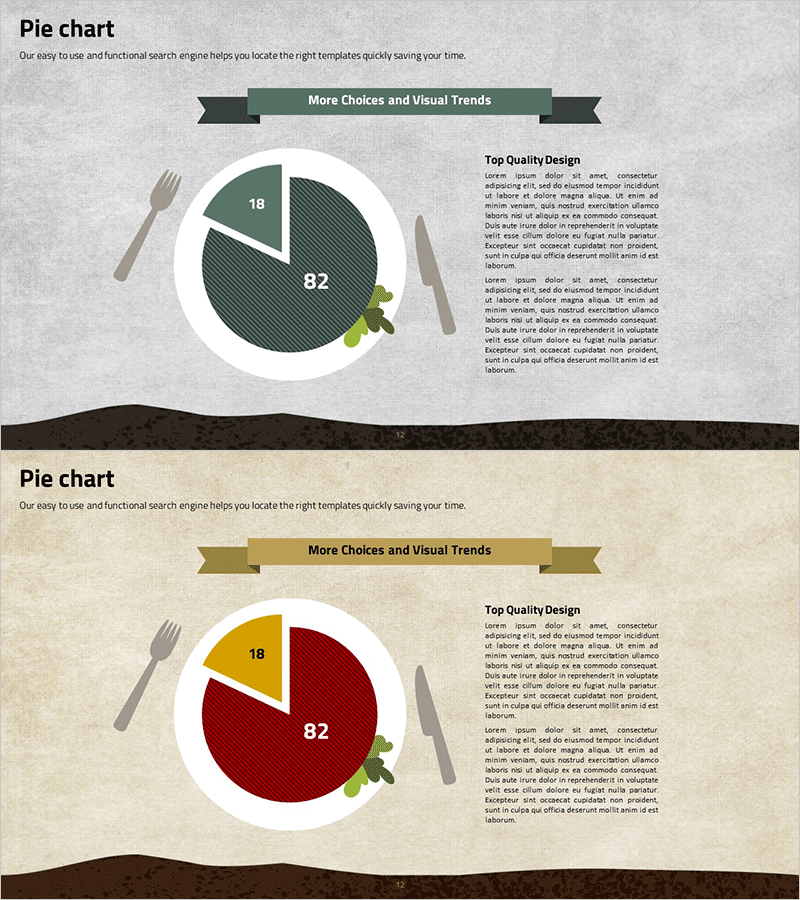
Plate Shape Pie Circle Graph – Visualizing Marketing Strategy
#Marketing Plan and Strategy #Graph #Marketing Strategy
-
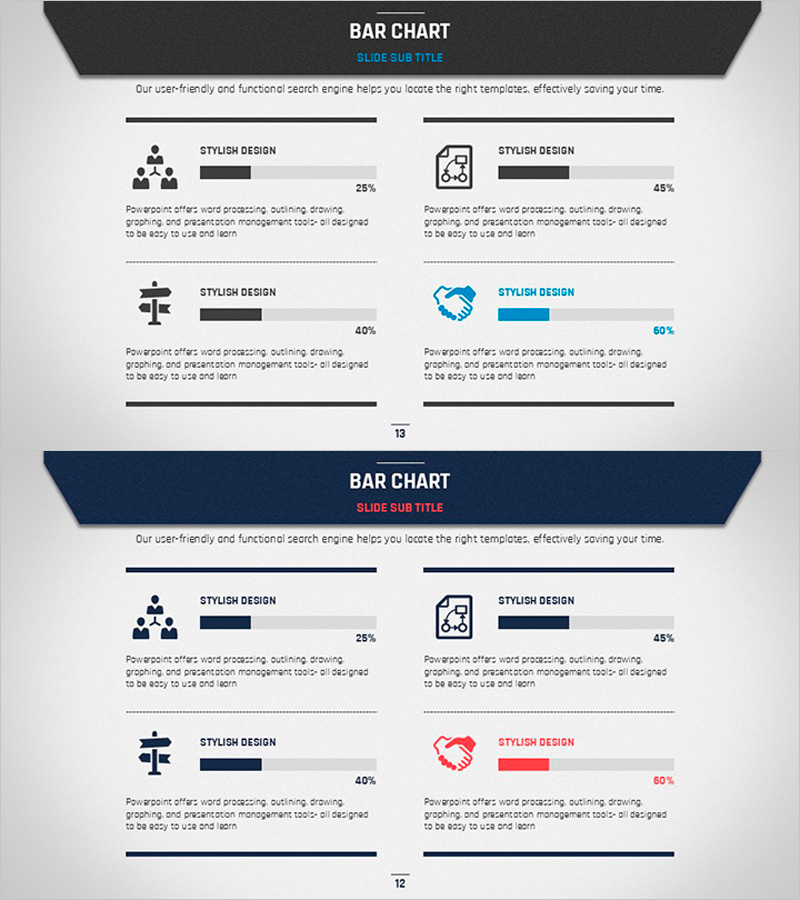
Business Plan Template Bar Chart
#Business Introduction #Operation Plan #Graph
-
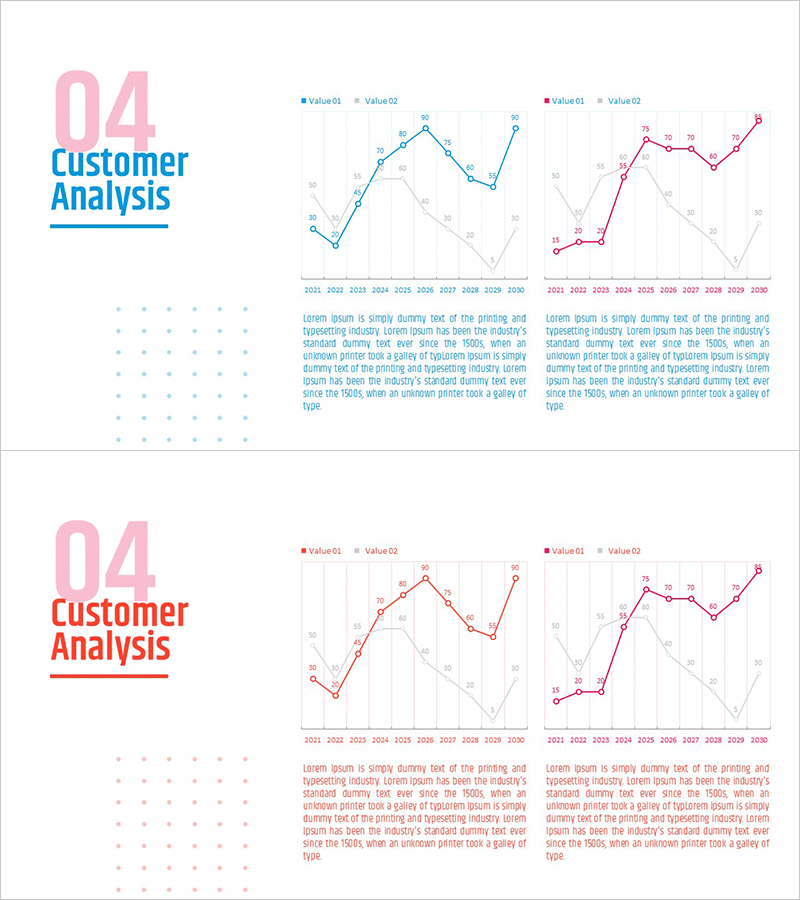
Comparison graph of broken lines by year – Market and Competitor Analysis
#Market and Competitor Analysis #Graph #Market Status
-
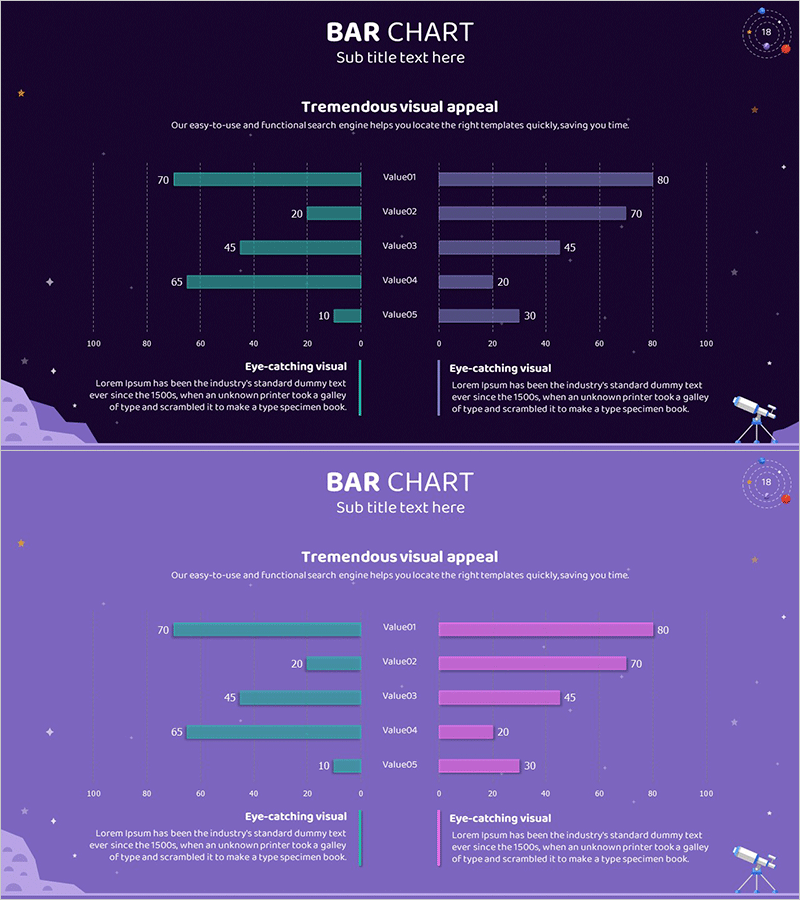
Astronomy Themed Bilinear Bar Graph – Market and Competitor Analysis
#Market and Competitor Analysis #Graph #Competitor Analysis
