Business Promotion Strategy
Sales Growth Rate and Profit Change Analysis Chart – Emphasizing Business Performance
RM0600002_13
- Last Update 12/21/2025
- File Size 1.1MB
- # of Slides 2
- File Format PPTX
- Slide Ratio 16:9
- Color
Keywords
About the Product
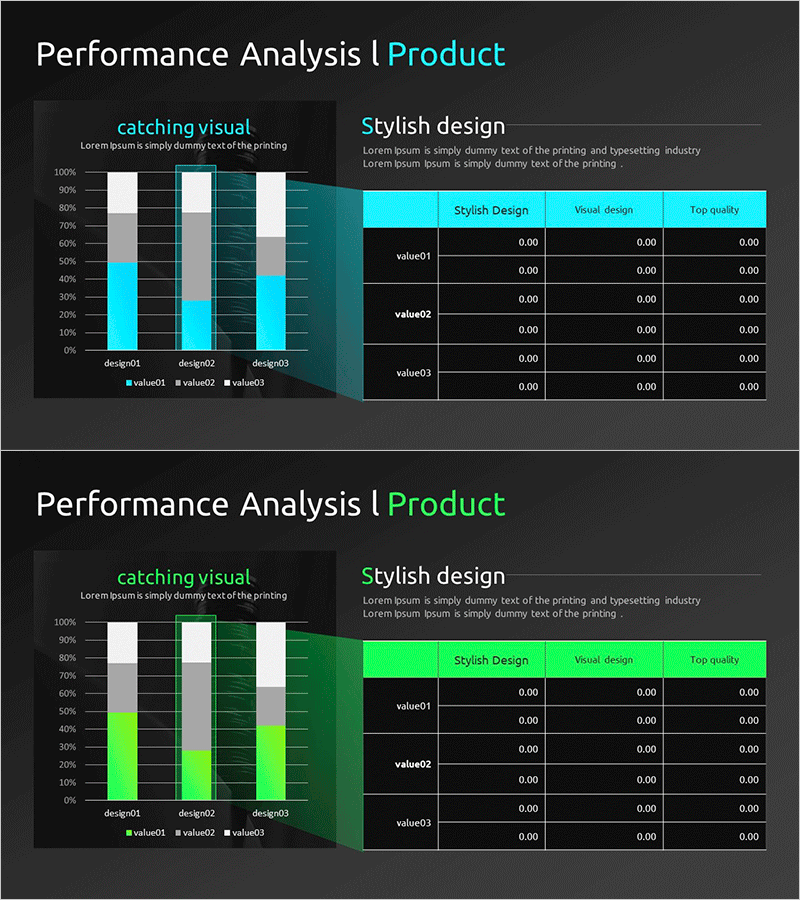
This slide visualizes the sales growth rate and profit changes using charts that effectively support data analysis. It employs vertical and horizontal bar structures to intuitively present performance comparisons, enhancing data visibility with a harmonious blend of blue, green, and gray. Ideal for business reports and presentations related to business strategy, market and competitive analysis, it carries the emotional message of 'business performance', making it impactful for investor or executive presentations. Text and data areas are easy to replace, with an average editing difficulty level rated as 'moderate', allowing for quick integration into various presentations.
Related Products
-
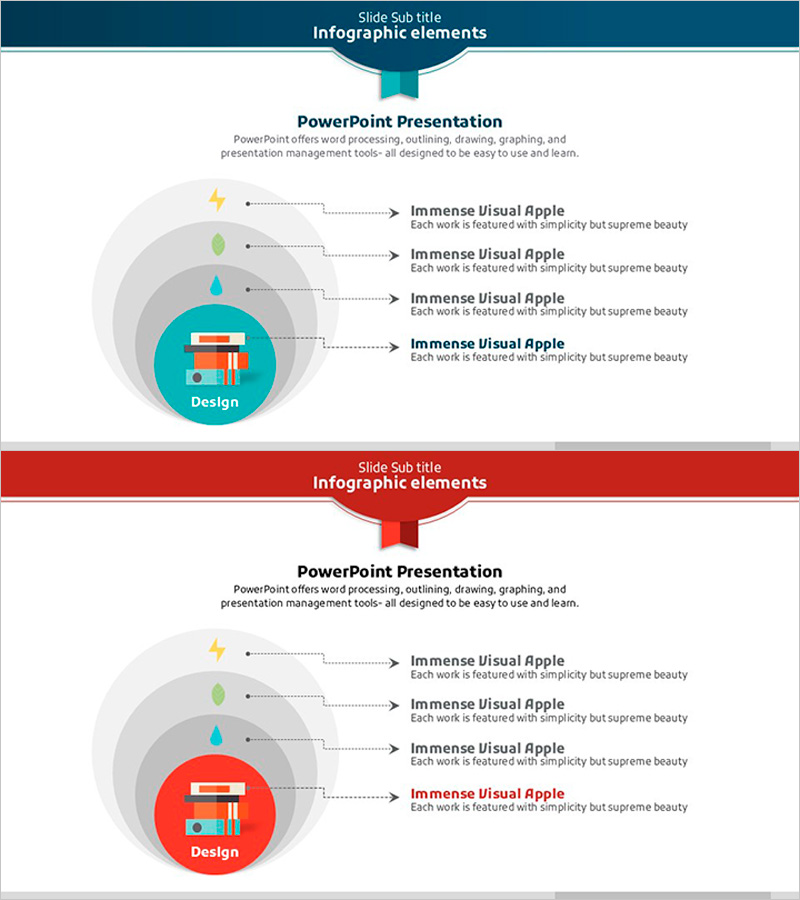
Nested Natural Elements Diagram – Efficient Operational Planning
#Business Management #Operation Plan #Diagram
-

Emphasized Quote with Icon Highlights
#Company Introduction #Business Introduction #Business Vision and Strategy
-
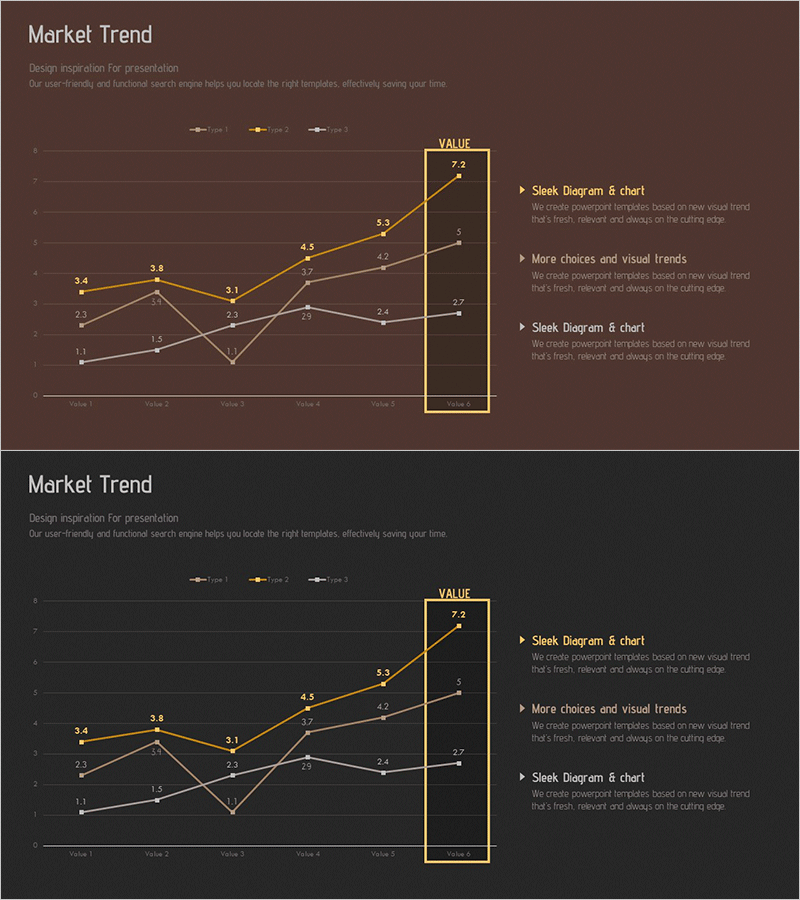
Market Trend Line Comparison Analysis Chart
#Market and Competitor Analysis #Graph #Competitor Analysis
-
Affiliate Business Income Statement – Visualizing Financial Performance
#Financial Plans and Performance #Diagram #Income Statement
