Business Promotion Strategy
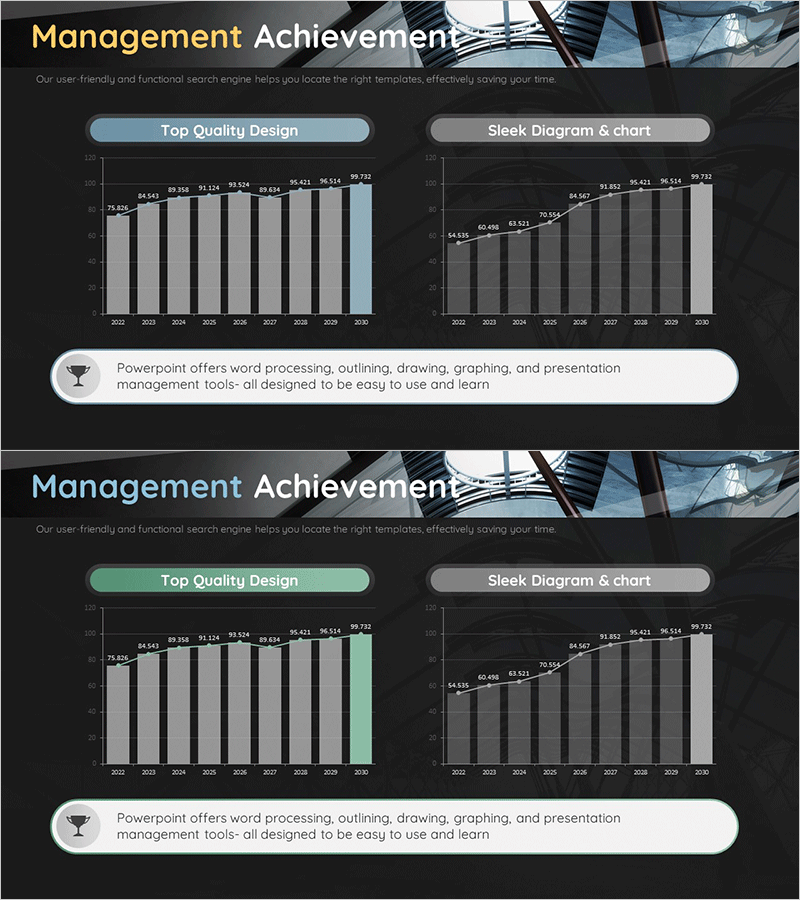
Management Performance Analysis Mixed Chart – Data Insights and Strategic Analysis
RM0500004_15
- Last Update 12/21/2025
- File Size 1.4MB
- # of Slides 2
- File Format PPTX
- Slide Ratio 16:9
- Color
Keywords
About the Product
This slide utilizes a mixed chart for management performance analysis, effectively communicating data insights. The left side features a vertical bar chart, while the right showcases a line graph, illustrating year-over-year performance changes clearly. The combination of yellow, blue, and green colors emphasizes the positive impact of each metric. This slide is ideal for presentations about business strategy and market competitiveness, providing essential insights for decision-makers.
Related Products
-
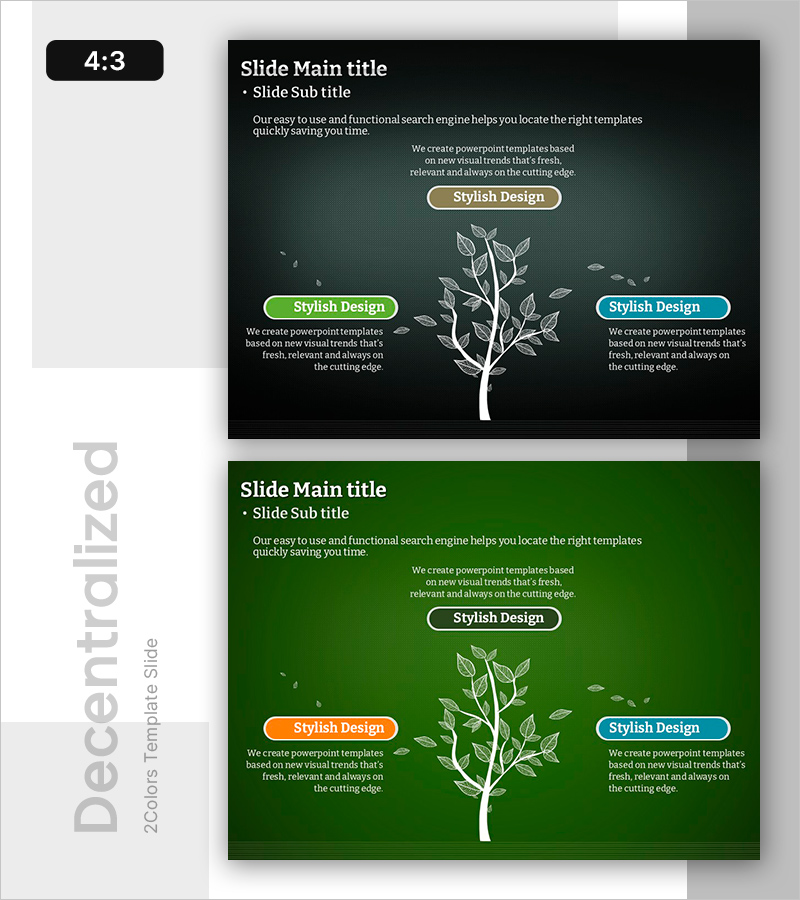
Branching Strategy Design Slide – Business Vision and Strategy
#Business Vision and Strategy #Diagram #Other
-
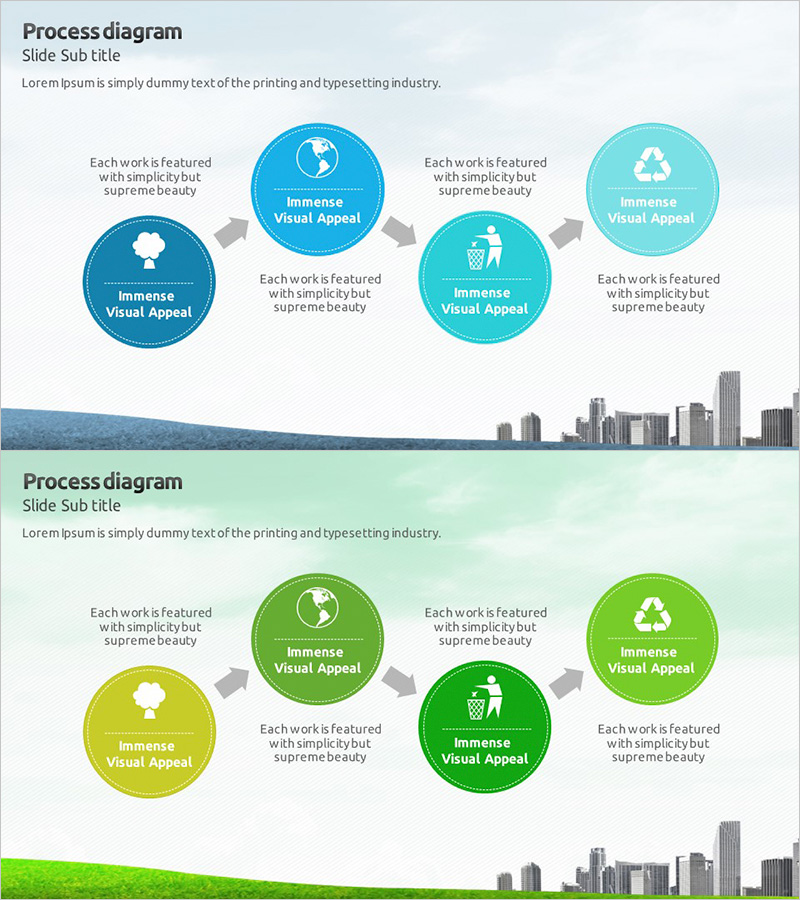
Echo Service Process Diagram – Sustainable Business Strategy
#Business Promotion Strategy #Operation Plan #Diagram
-

Mobile Global Service Differentiation Strategy Slide
#Product/Service #Marketing Plan and Strategy #Diagram
-
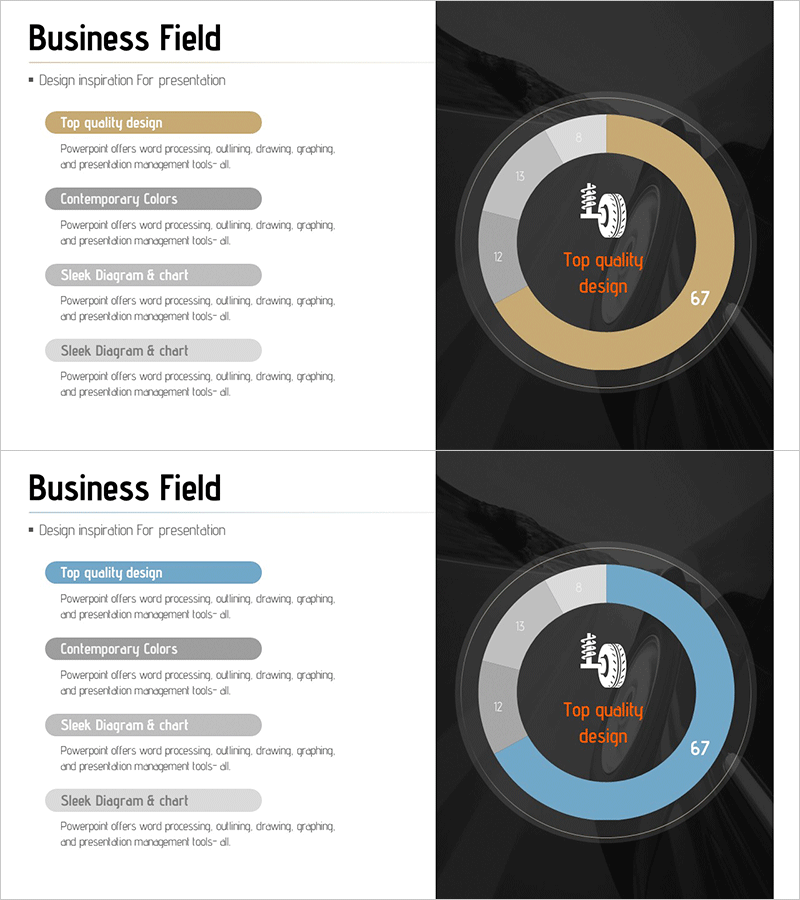
Business Area Analysis Donut Chart – Clear Visualization
#Product/Service #Business Introduction #Graph
