Business Introduction
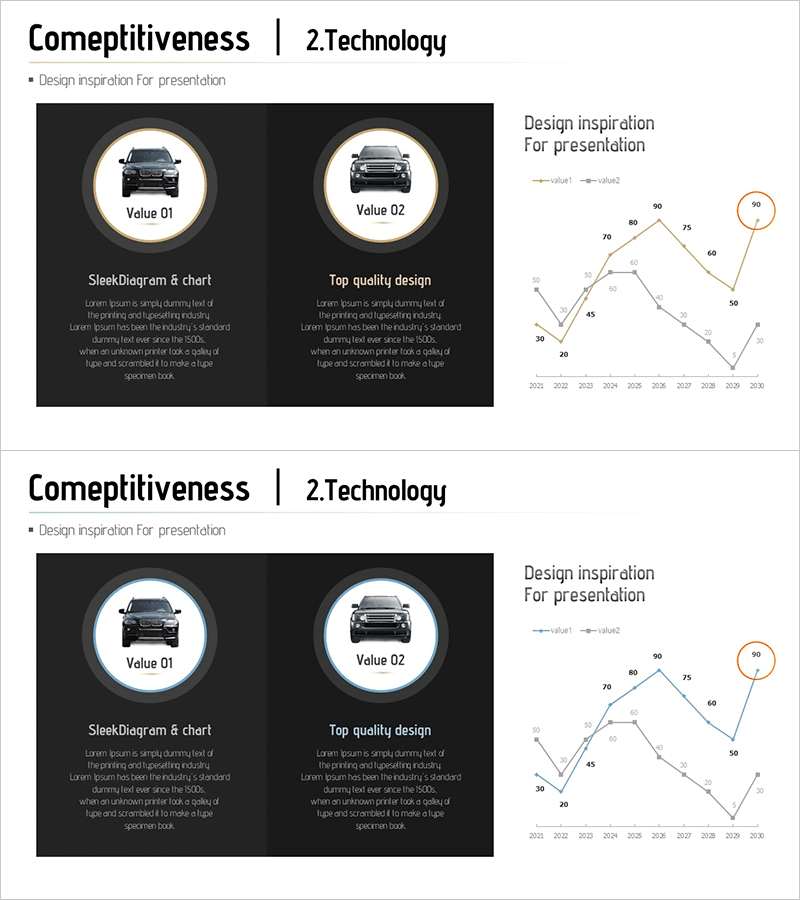
Car Model Revenue Comparison Analysis Graph – Insights into Market Trends
RM0500003_14
- Last Update 12/21/2025
- File Size 1.2MB
- # of Slides 2
- File Format PPTX
- Slide Ratio 16:9
- Color
Keywords
About the Product
This slide presents a graph for comparing car model revenues, visually emphasizing competitive advantages. With a sophisticated design featuring a blend of blue and brown, it reflects differentiated business environments. This graph is ideal for analyzing technological status and market trends in the automobile industry, making it an excellent tool for showcasing profitability and competitiveness. It's particularly effective for use in internal reports or investment proposals. Editing difficulty is moderate, ensuring that quick replacements of graphs and text are possible for fast application.
Related Products
-

Wedding Dress Types – Understanding the Market through Customer Analysis
#Product/Service #Market and Competitor Analysis #Product/Service Introduction
-
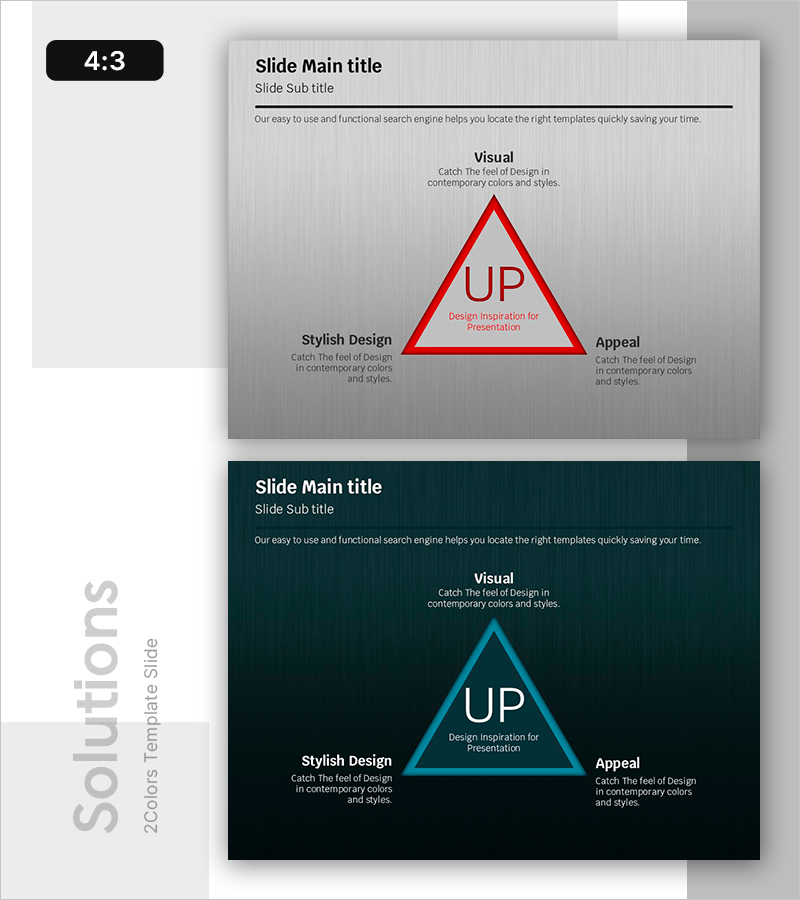
Diagram Presenting Three Strategic Directions
#Business Vision and Strategy #Risk Management and Regulatory Compliance #Diagram
-
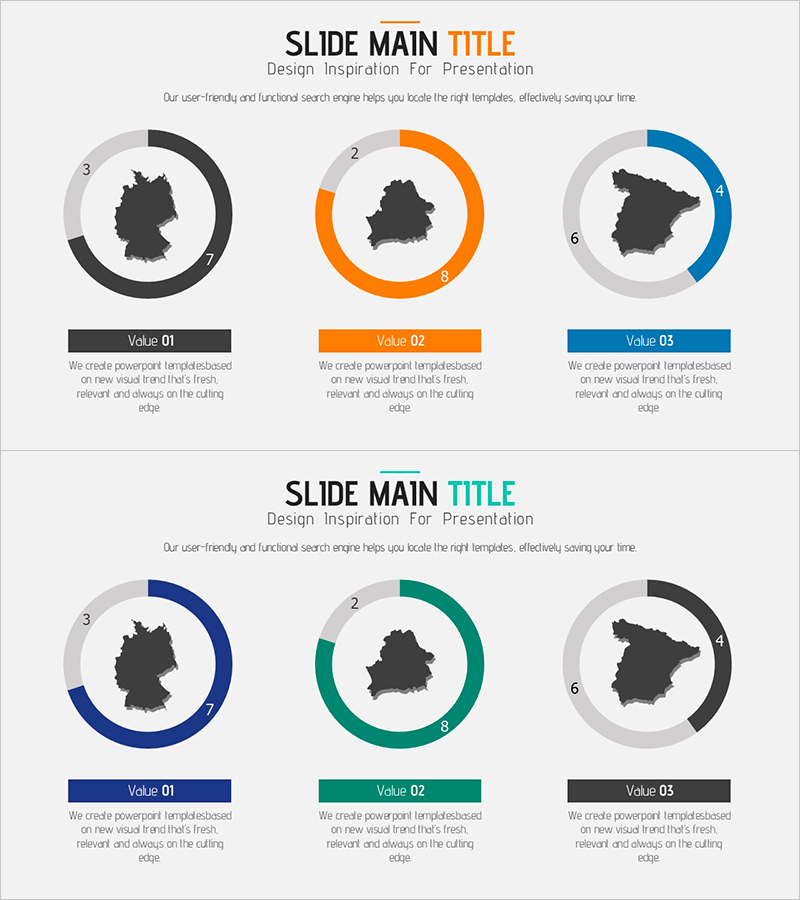
National Analytical Donut Chart – Market Share and Insights
#Market and Competitor Analysis #Graph #Market Share
-

Introducing the Perfect Design Team – Power of Professionalism and Collaboration
#Company Introduction #Diagram #Manpower
