Business Introduction
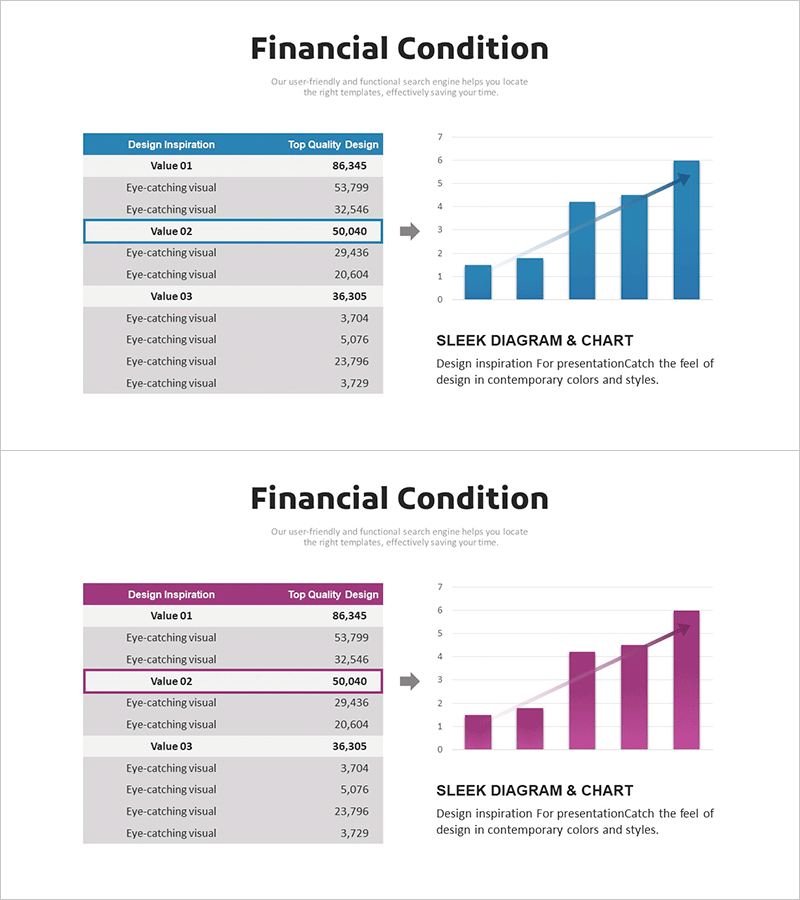
Financial Status and Stability Analysis Graph
RM0500001_7
- Last Update 12/21/2025
- File Size 1MB
- # of Slides 2
- File Format PPTX
- Slide Ratio 16:9
- Color
Keywords
About the Product
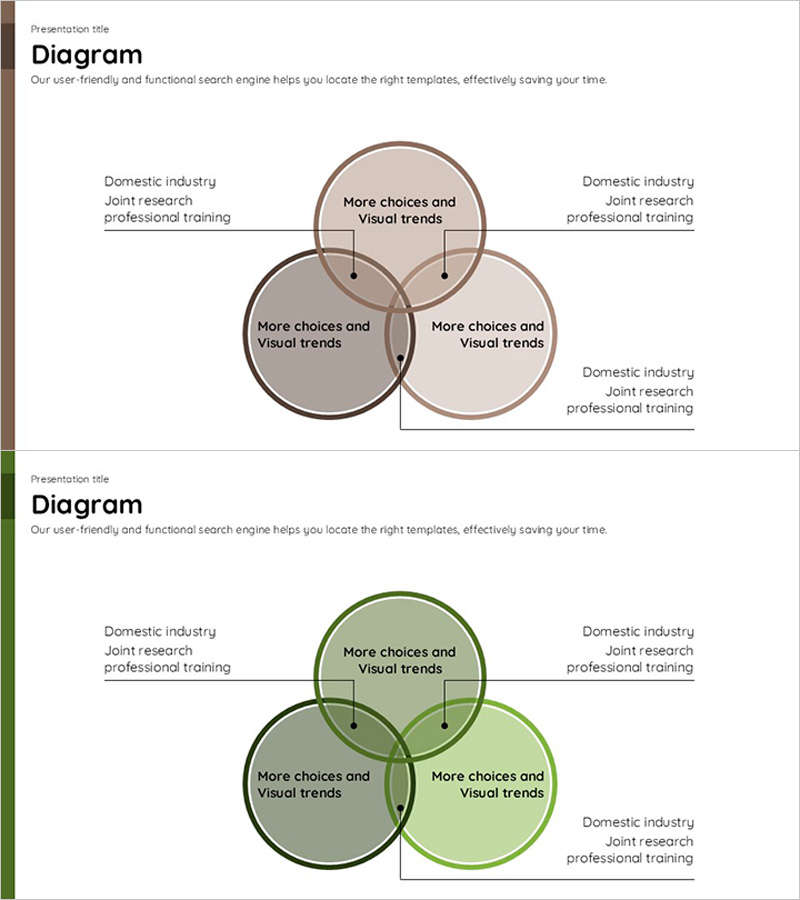
This slide features horizontal and vertical bar graphs to effectively visualize financial status. With a sleek combination of blue and purple colors, it conveys stability and trustworthiness. This template is designed to clearly compare and analyze financial data, making it highly useful in various business contexts such as business reports or investment proposals. Users can easily replace the data, ensuring convenient editing with a moderate level of effort.
Related Products
-
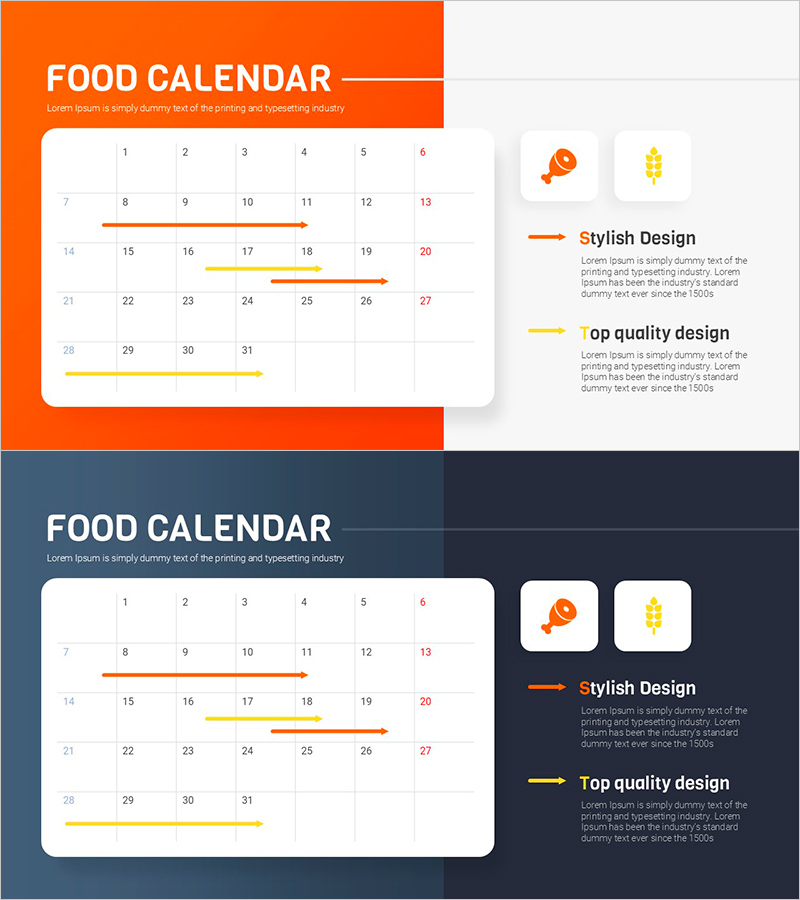
Food UI PPT Schedule – Infographic Suitable for Business Strategy
#Business Promotion Strategy #Business Management #Diagram
-
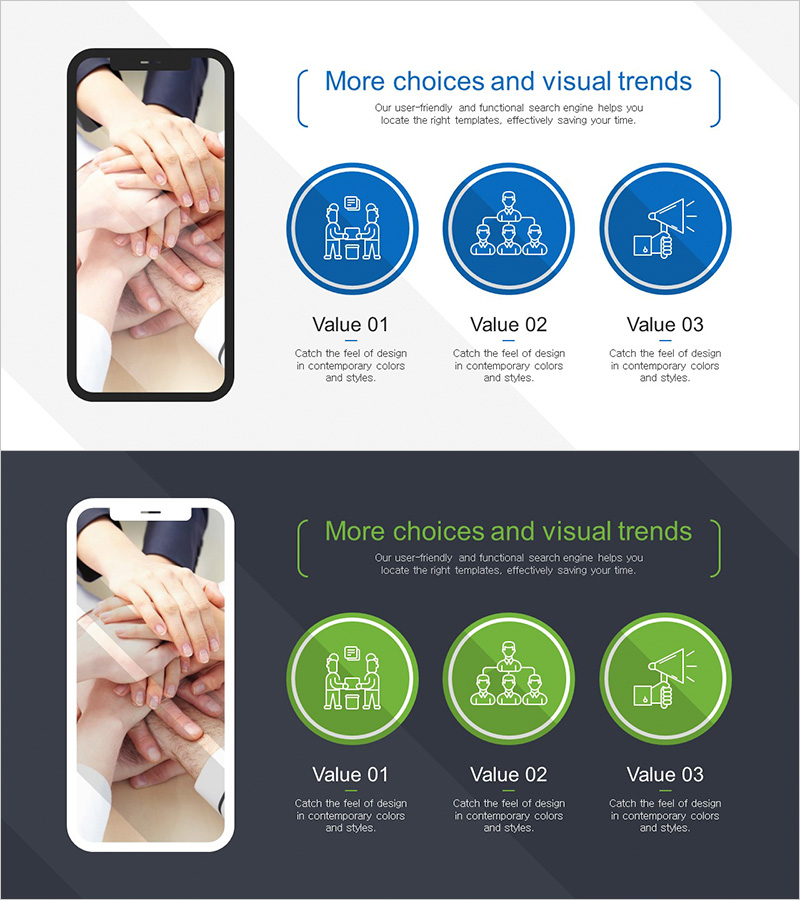
Establishing Collaborative Business Goals – Essential Diagram for Goal Setting
#Product/Service #Business Vision and Strategy #Diagram
-
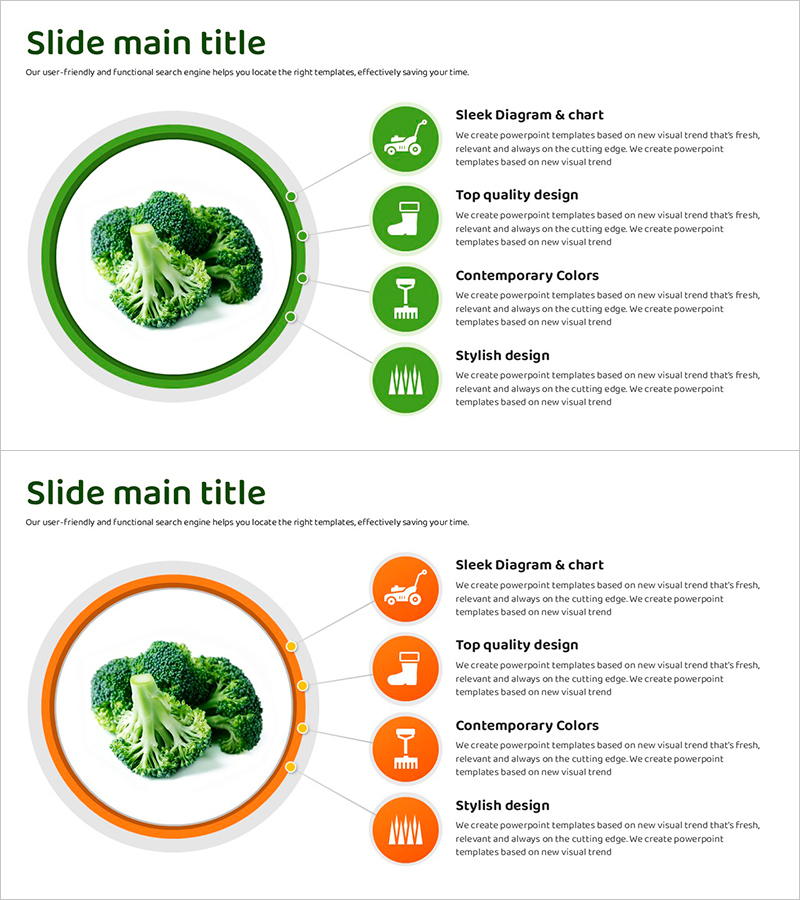
Broccoli Cultivation Diagram – Efficient Production Planning
#Business Promotion Strategy #Operation Plan #Diagram
-
Feature Overlap Diagram – Visualizing Business Vision and Strategy
#Product/Service #Business Vision and Strategy #Diagram
