Company Introduction
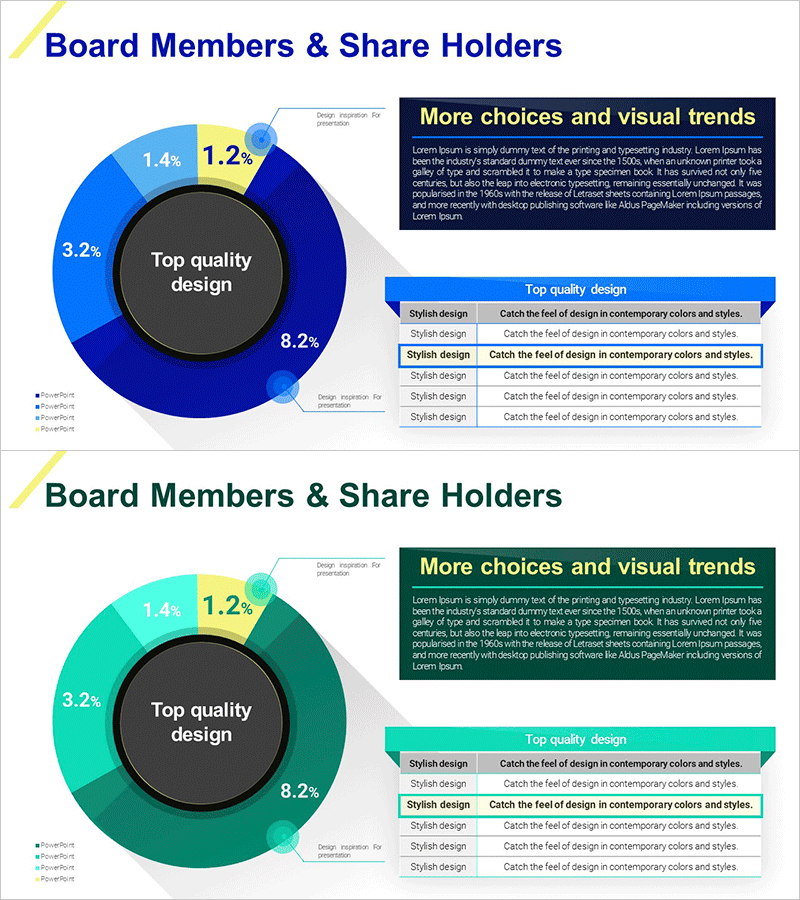
Detailed Analysis of Shareholder Status Donut Chart
RM0300023_7
- Last Update 12/21/2025
- File Size 0.4MB
- # of Slides 2
- File Format PPTX
- Slide Ratio 16:9
- Color
Keywords
About the Product
This slide features a donut chart that visually represents the composition of shareholders, highlighting their respective proportions effectively. The modern design elements enhance the clarity of information delivery. With primary colors of blue and green, it creates a visual contrast that makes it easy to understand the types and proportions of shareholders. Ideal for investor reports, executive presentations, or shareholder meetings, this slide facilitates quick data replacement and editing complexity is rated as 'easy'.
Related Products
-
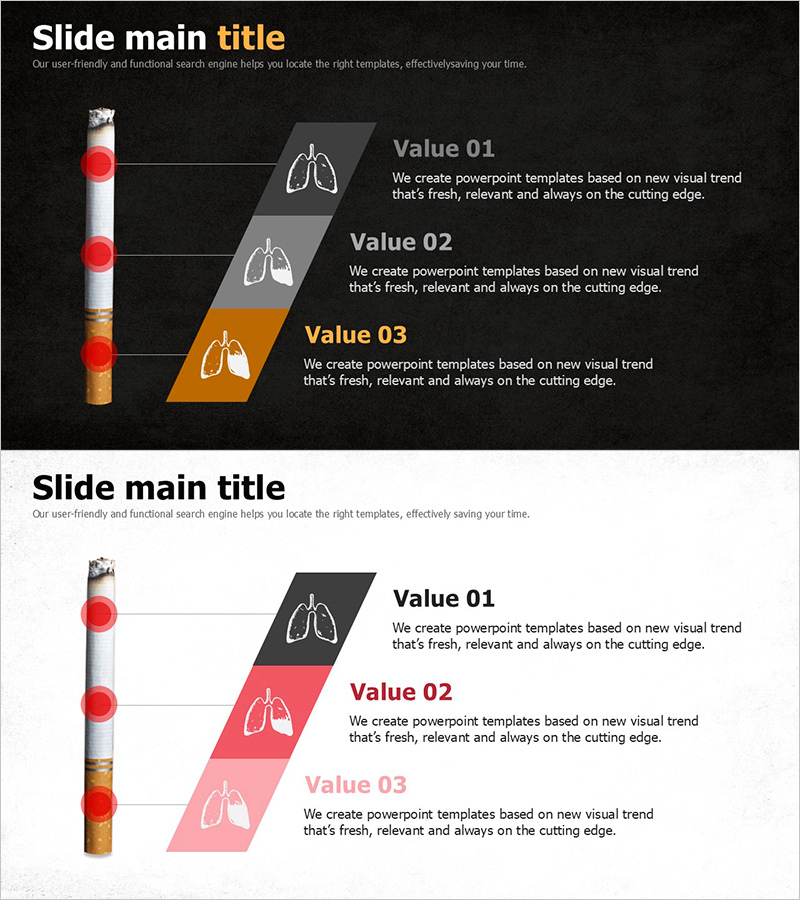
Single Slide Template for Visualizing Stages of Lung Cancer
#Business Promotion Strategy #Diagram #Phase-wise Schedule Plan
-
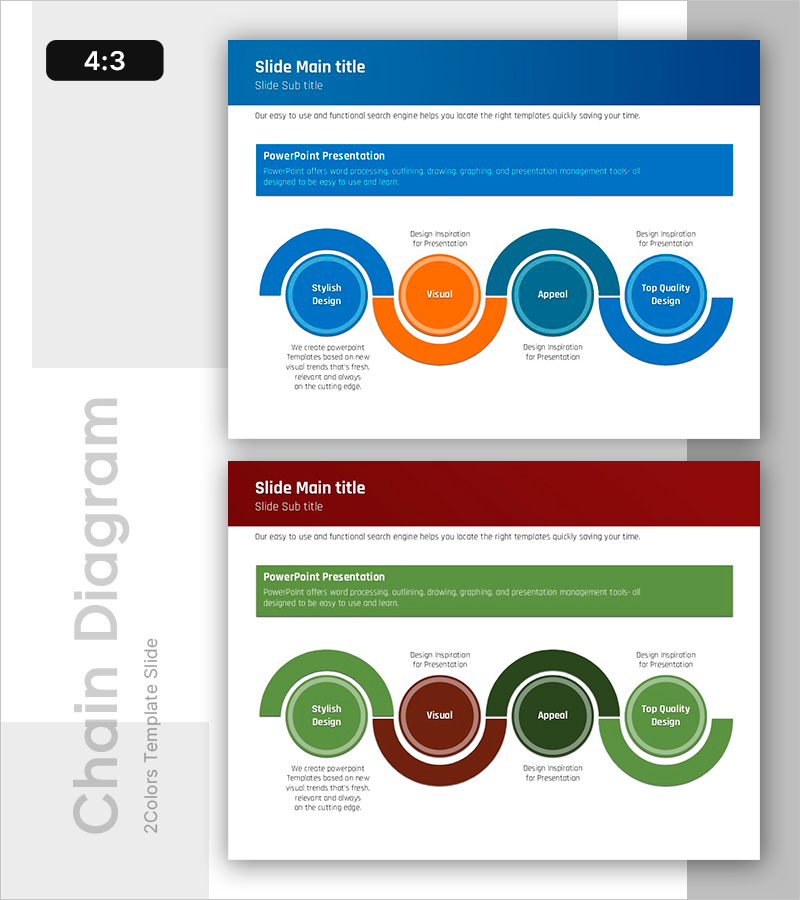
Connection Flow Diagram – Visualizing Business Strategy
#Business Promotion Strategy #Operation Plan #Diagram
-

Three Health Benefits of Coffee Consumption – Harmony of Taste and Health
#Business Introduction #Technology Sector #Diagram
-
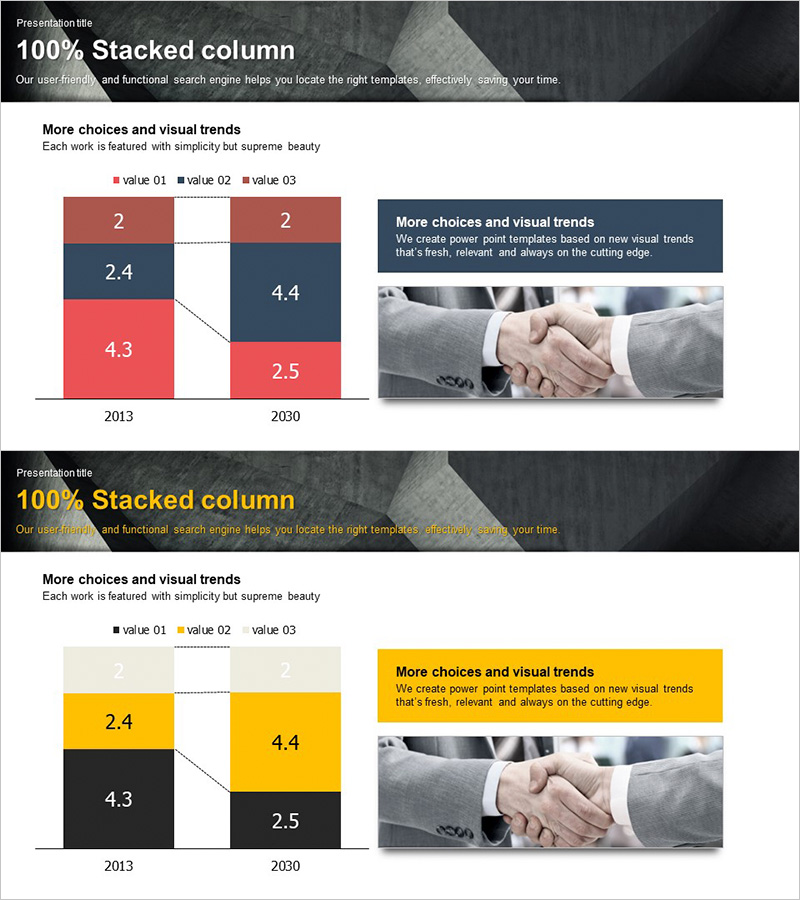
Business Performance Analysis Graph – Vertical Bars
#Business Promotion Strategy #Graph #Revenue Outlook and Expected Effects
