Company Introduction
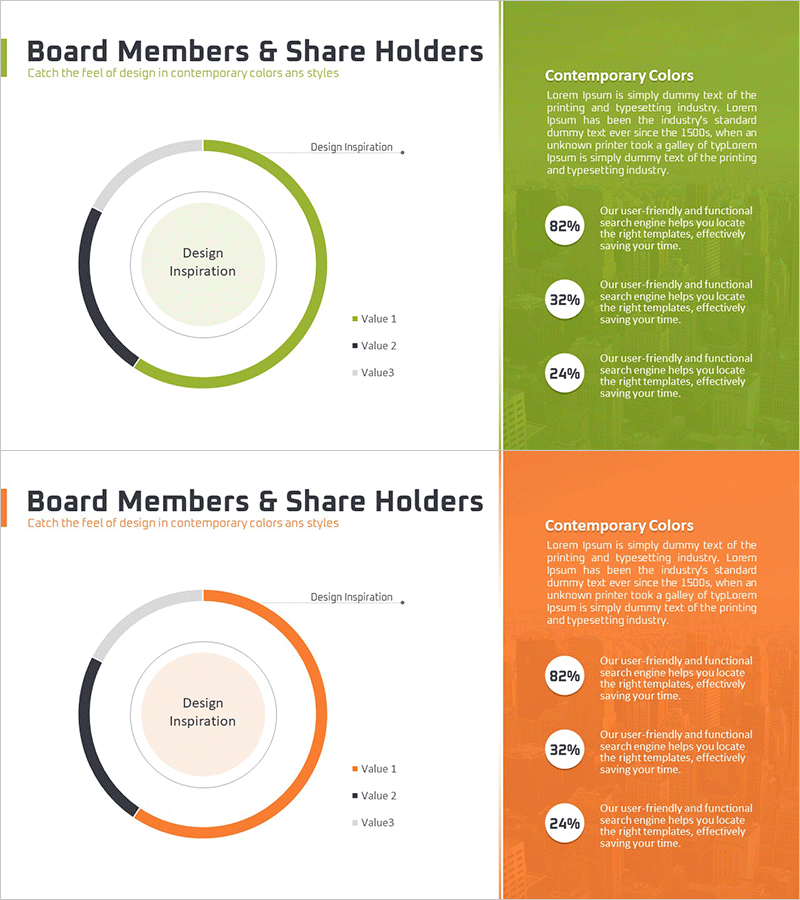
Status Analysis Thin Donut Chart - Visualizing Shareholder Status in PowerPoint
RM0300012_7
- Last Update 12/21/2025
- File Size 1.3MB
- # of Slides 2
- File Format PPTX
- Slide Ratio 16:9
- Color
Keywords
About the Product
This slide uses a thin donut chart to visually present shareholder status and market analysis aspects. The contrasting green and orange colors help deliver clear communication of the company's status and data. This slide aids in gaining an overview of stakeholder interests, market competitiveness, and shareholder information at a glance. It is suitable for corporate operational reports, shareholder meetings, and investor presentations, and it's easy to edit, allowing for seamless content replacement. Developed with practical use in mind, this PowerPoint enhances quick information delivery and understanding.
Related Products
-
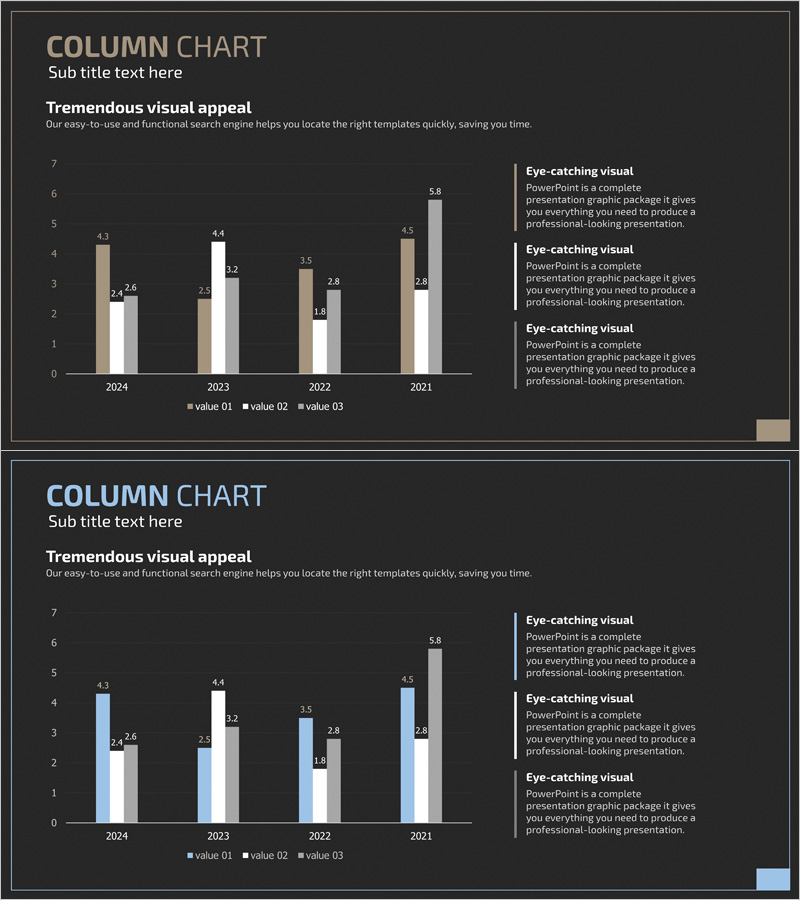
Market Analysis Graph by Year – Effective Tool for Competitor Analysis
#Market and Competitor Analysis #Graph #Competitor Analysis
-
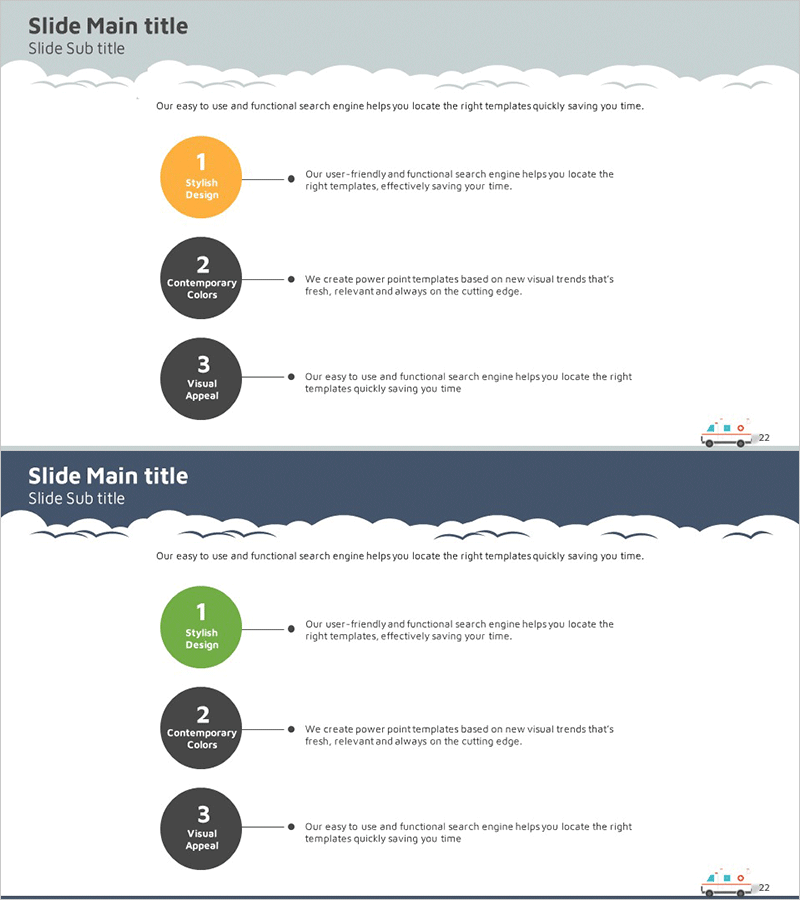
Business Promotion Plan Diagram - Key to Successful Management
#Business Management #Diagram #Promotion Plan
-

Interior Fusion Slide Template – Harmonizing Style and Innovation
#Product/Service #Operation Plan #Diagram
-
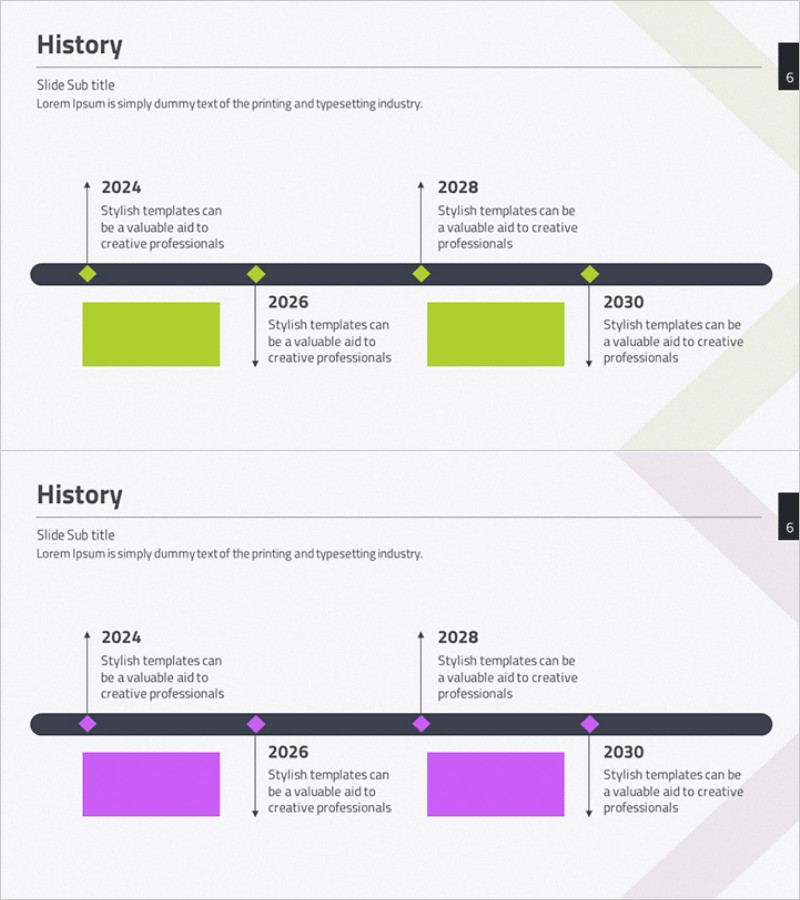
History Diagram - Visualize Company Milestones
#Company Introduction #Diagram #History
