Company Introduction
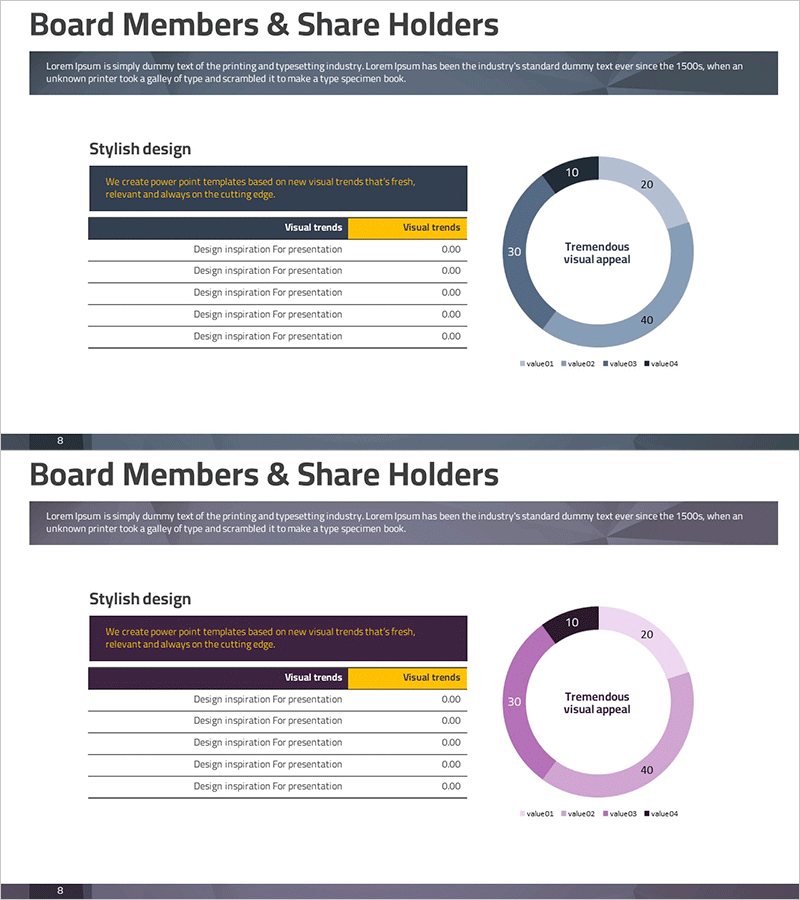
Status Analysis Donut Chart – Visualizing Market and Shareholder Status
RM0300001_7
- Last Update 12/21/2025
- File Size 0.4MB
- # of Slides 2
- File Format PPTX
- Slide Ratio 16:9
- Color
Keywords
- #Content-Based Slides
- #Design-Based Slides
- #Company Introduction
- #Market and Competitor Analysis
- #Diagram
- #Graph
- #Shareholder Structure
- #Market Analysis
- #Table
- #Circles
- #Standard Table
- #Doughnut Chart
- #16:9
- #status analysis
- #donut chart
- #shareholder status
- #market analysis
- #graph
- #main color
- #blue
- #brown
About the Product
This slide employs a donut chart to effectively visualize the status of shareholders and the market. The geometric design combines blue and brown to convey trust and professionalism, making data comparison easy with its clean layout. It is ideal for corporate status reports or investment proposals. The replaceable elements include text and charts, with an overall editing difficulty rated as 'easy', making it user-friendly.
Related Products
-
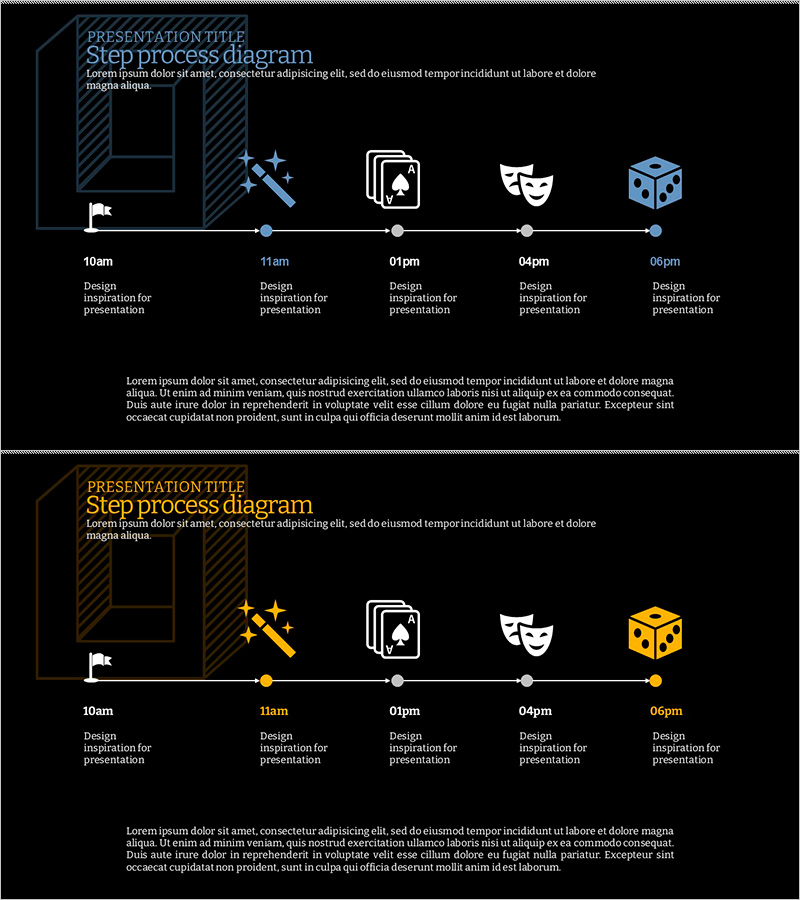
The Process of Becoming a Successful Magician - Path to Success
#Business Promotion Strategy #Operation Plan #Diagram
-
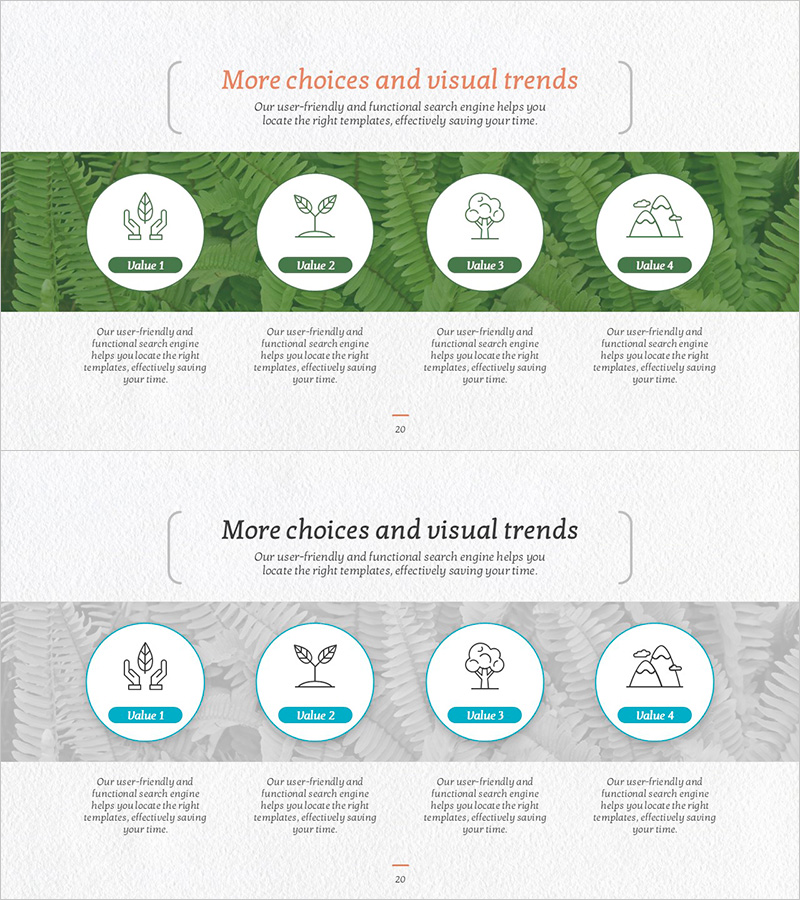
Forest Protection Policy Diagram – Business Goals and Necessities
#Business Vision and Strategy #Diagram #Business Goals
-
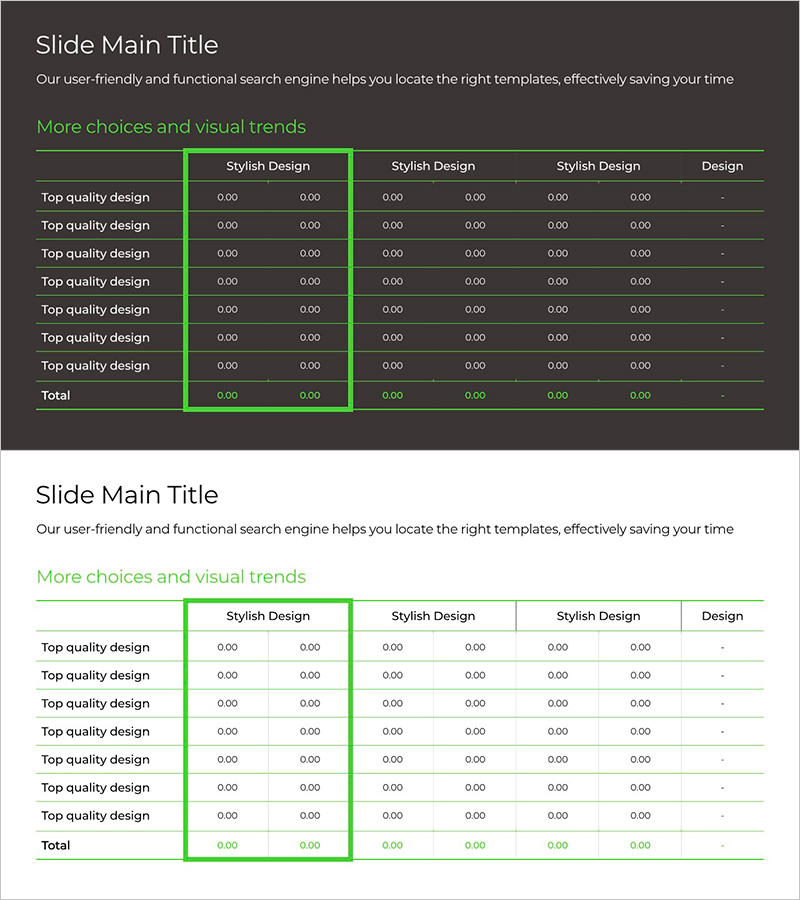
Green & Gray Template Wide Table – Visualizing Financial Plans and Performance
#Financial Plans and Performance #Diagram #Cash Flow Statement
-
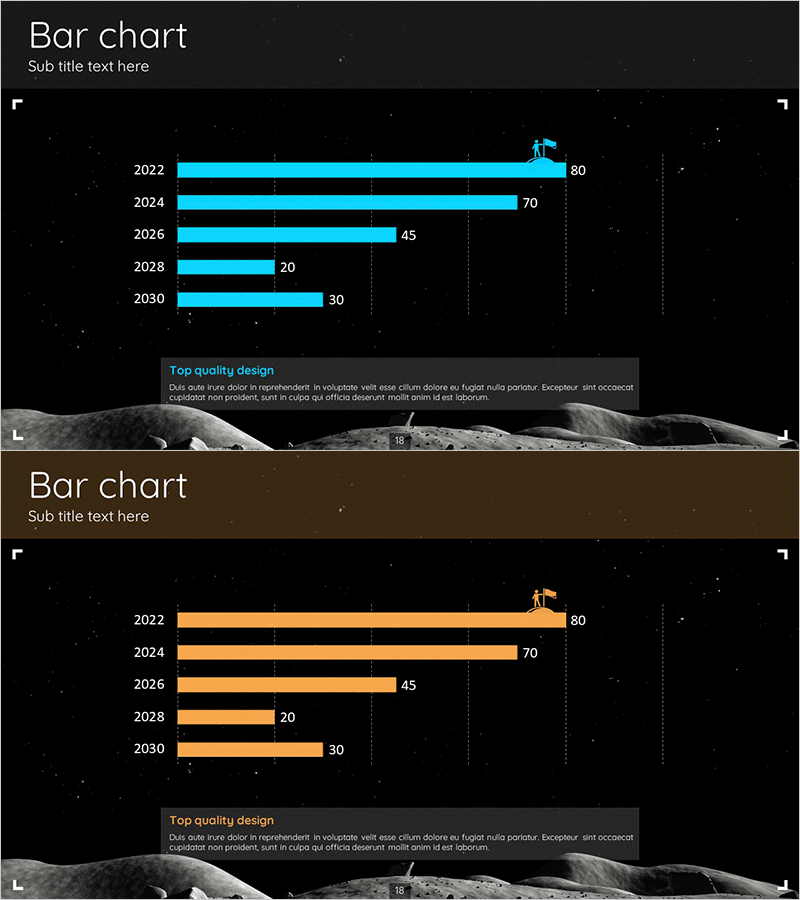
Space Exploration Theme Bar Graph – Ideal Visualization for Market Analysis
#Market and Competitor Analysis #Graph #Market Analysis
