Company Introduction
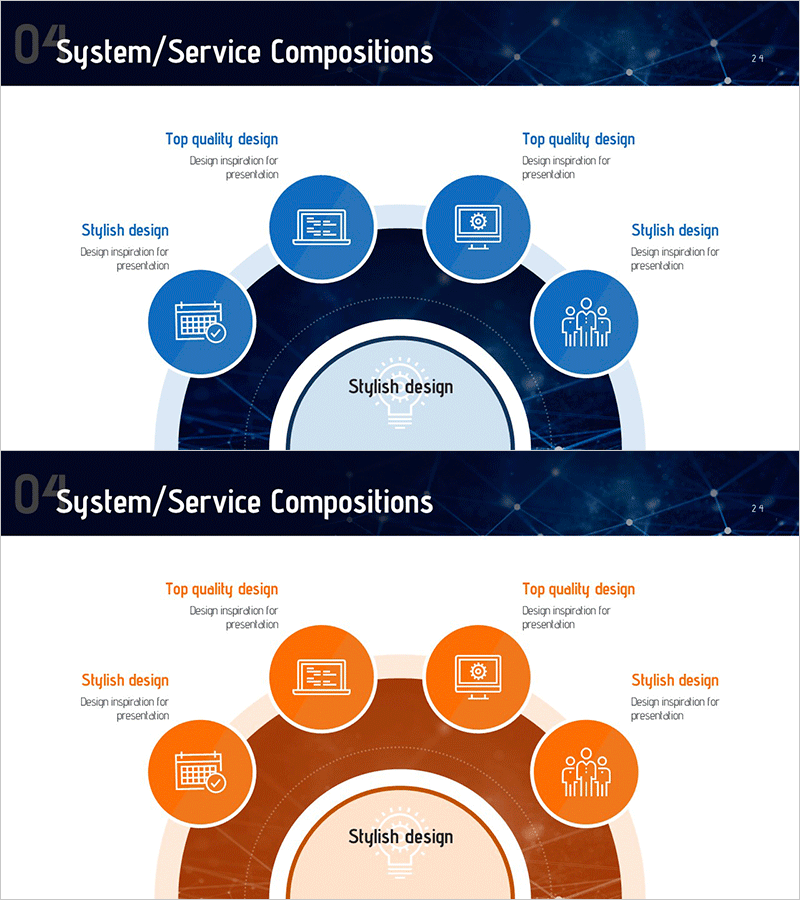
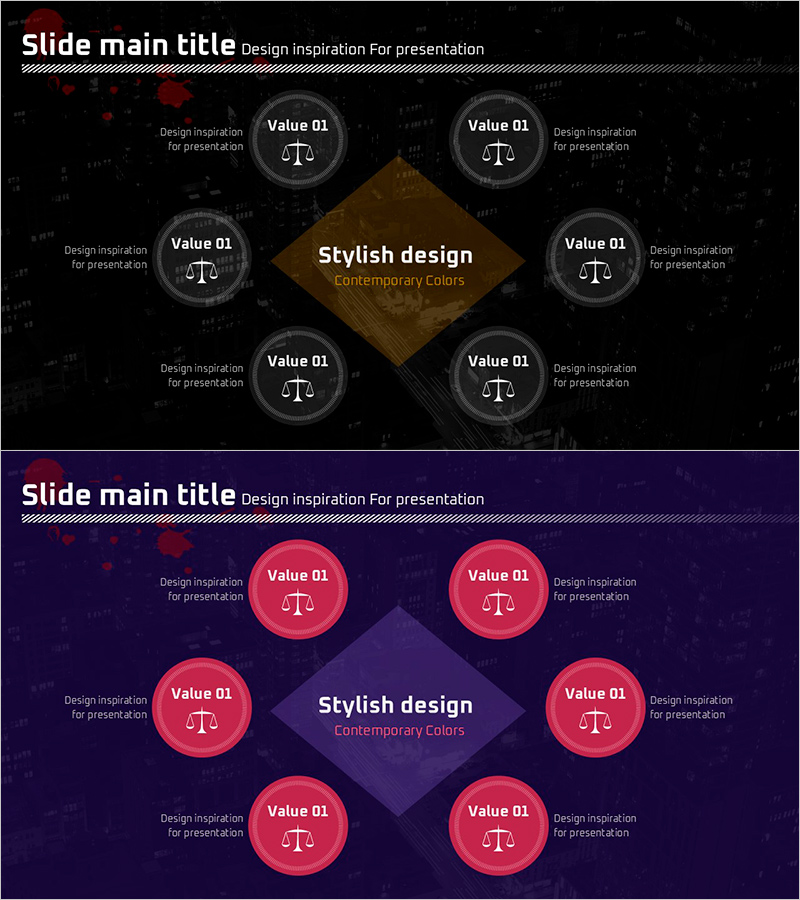
Service Composition Diffusion Diagram – Presenting Technology Sector
RM0200015_23
- Last Update 12/21/2025
- File Size 2.8MB
- # of Slides 2
- File Format PPTX
- Slide Ratio 16:9
- Color
Keywords
About the Product
This slide visually represents the diffusion of service composition, featuring a non-centralized structure that emphasizes the interactions among various components. The harmonious blue and orange color scheme provides a sense of trust and vitality. It's effective for explaining service structures in startups or the technology sector, helping audiences easily understand the relationships between different components. The editing difficulty is rated as 'easy', allowing for quick integration into various presentations due to the replaceable text and graphics.
Related Products
-
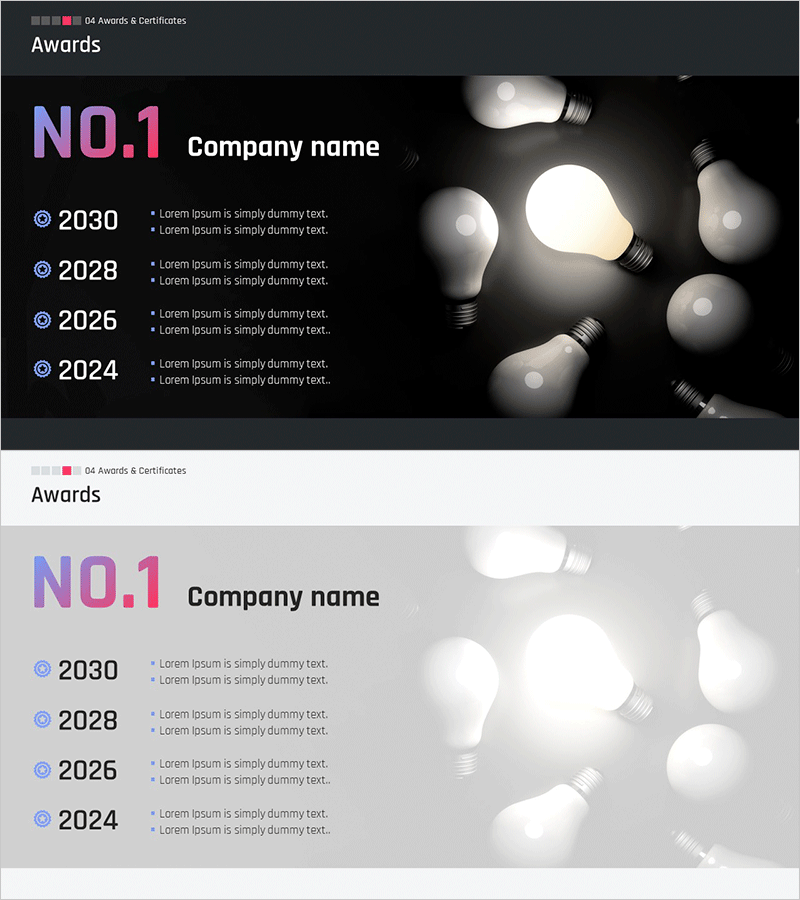
Best Company Awards by Year – Highlighting Outstanding Achievements
#Company Introduction #Diagram #Awards and Certifications, and Patents
-
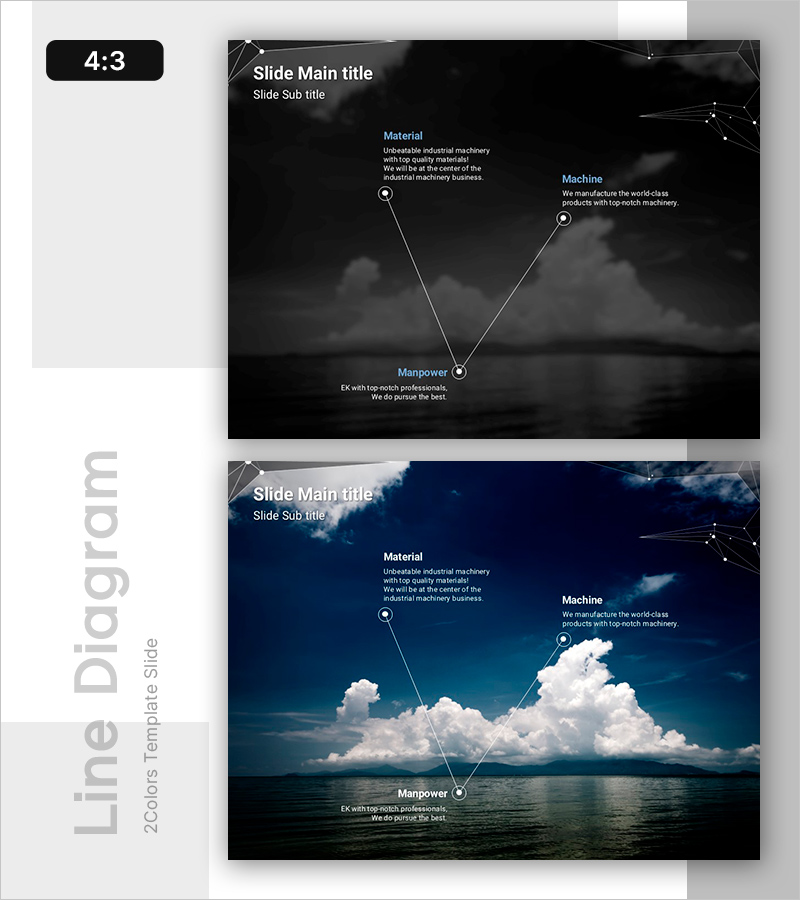
Slide Showcasing 3 Connected Elements Harmoniously
#Product/Service #Technology Sector #Diagram
-
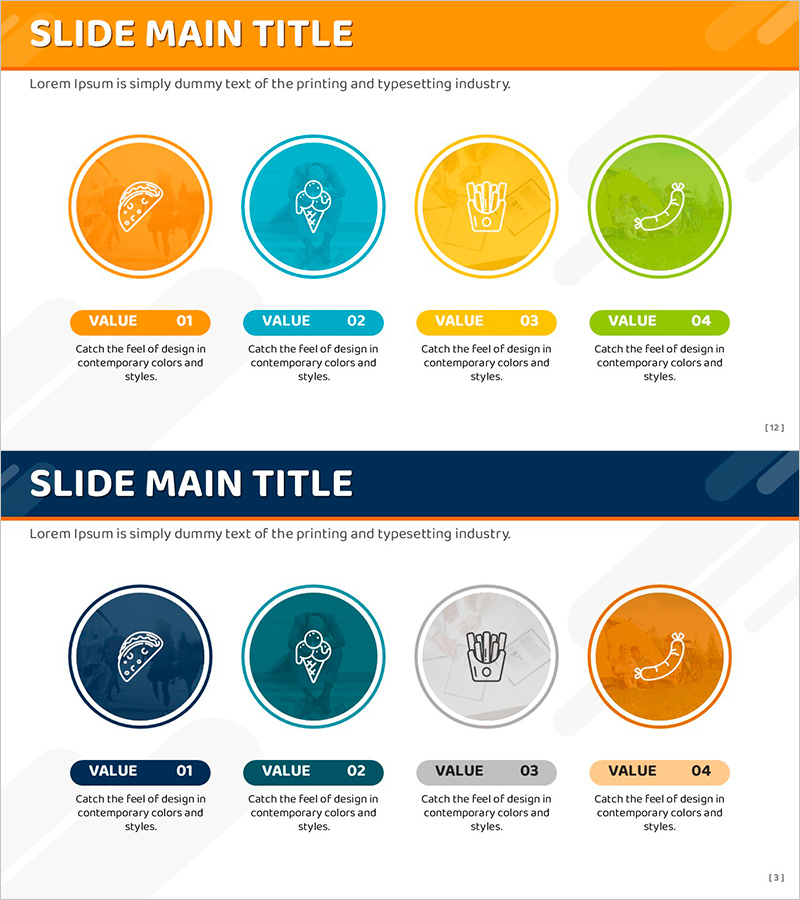
Cluster Diagram Slide for Main Menu Strategies
#Product/Service #Business Introduction #Diagram
-
Criminal Trial Diagram – Business Strategy and Overview
#Business Introduction #Business Vision and Strategy #Diagram
