Company Introduction
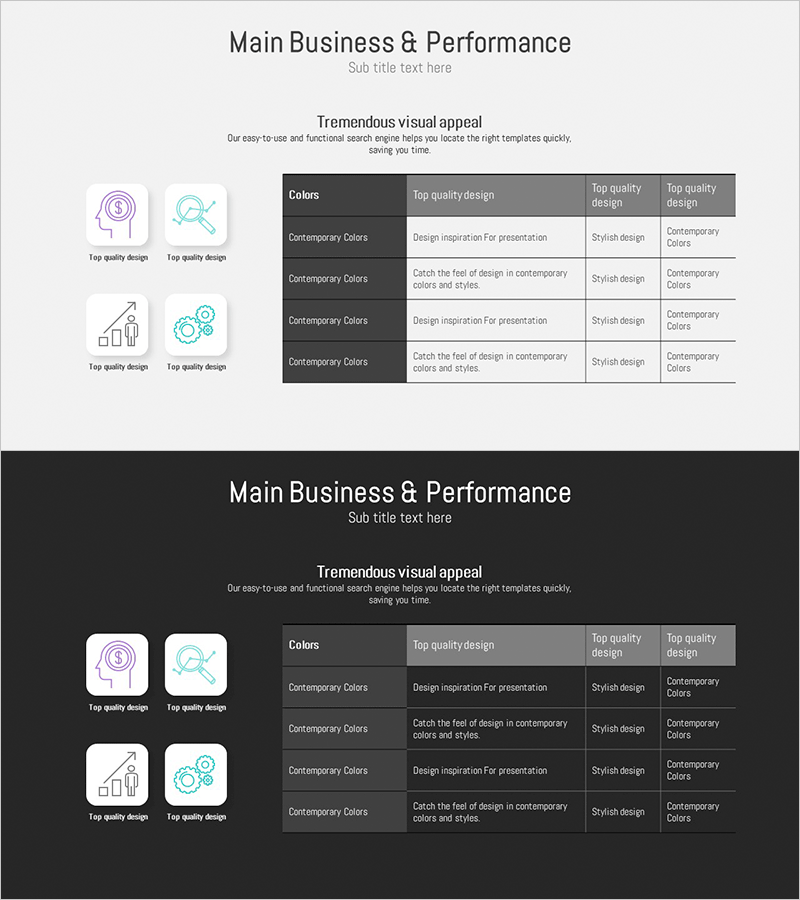
Key Performance Table Diagram for Visualizing Business Goals – Performance-Based Strategy
RM0200008_7
- Last Update 12/21/2025
- File Size 1MB
- # of Slides 2
- File Format PPTX
- Slide Ratio 16:9
- Color
Keywords
About the Product
This slide utilizes a key performance table diagram to effectively visualize essential achievements and business objectives of an organization. With a minimal and stylish design, the color scheme of gray, black, and white provides stability and professionalism. The closed cluster structure distinctly separates each performance indicator, facilitating strategic decision-making and performance management. This slide is especially useful in various business contexts such as corporate presentations and capability assessment reports. Its easily editable structure and high practicality allow for straightforward data replacement, with an overall editing difficulty rated as 'medium'.
Related Products
-
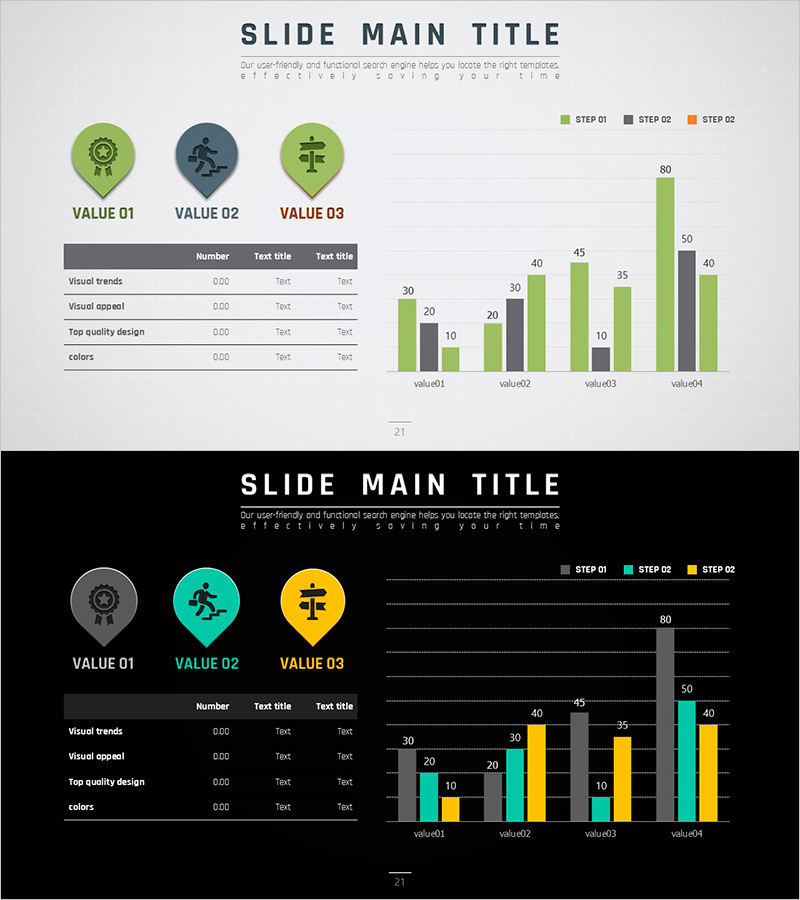
THE ROAD Presentation Table & Tied Vertical Bar Graph – Market and Competitor Analysis
#Market and Competitor Analysis #Diagram #Graph
-

Securities Business Overview – Presentation for Successful Strategy
#Company Introduction #Business Introduction #Business Vision and Strategy
-
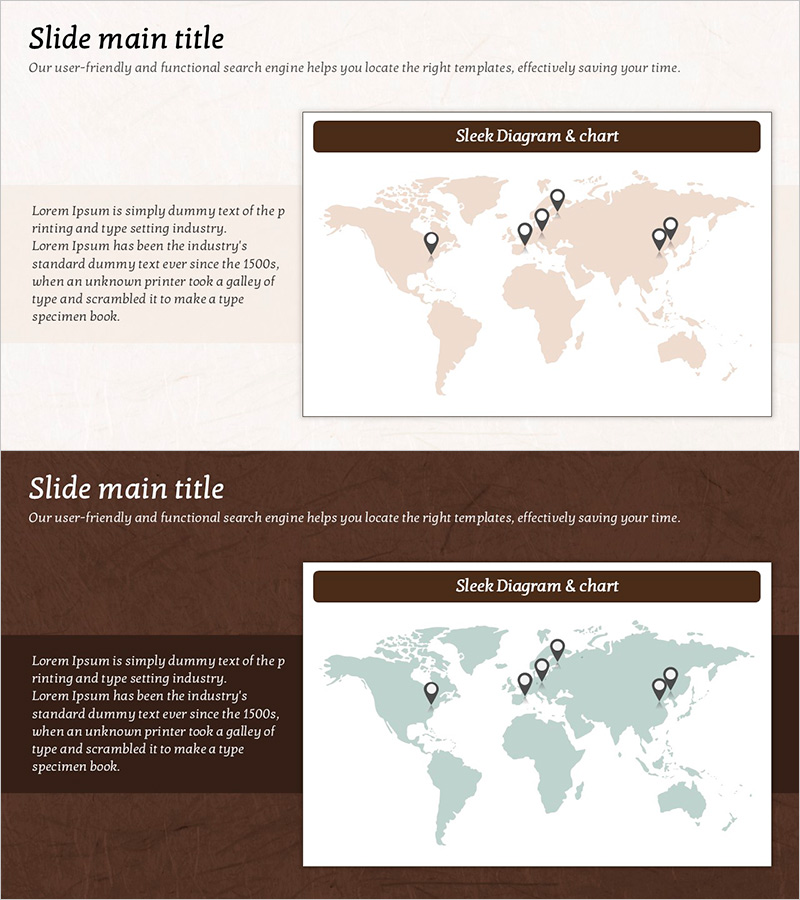
Brown Background Global Market Analysis – Utilizing Cluster Diagrams
#Market and Competitor Analysis #Diagram #Other
-

Background and Necessity of Securities Business – Strategy and Vision
#Business Vision and Strategy #Business Background and Necessity
