Market and Competitor Analysis
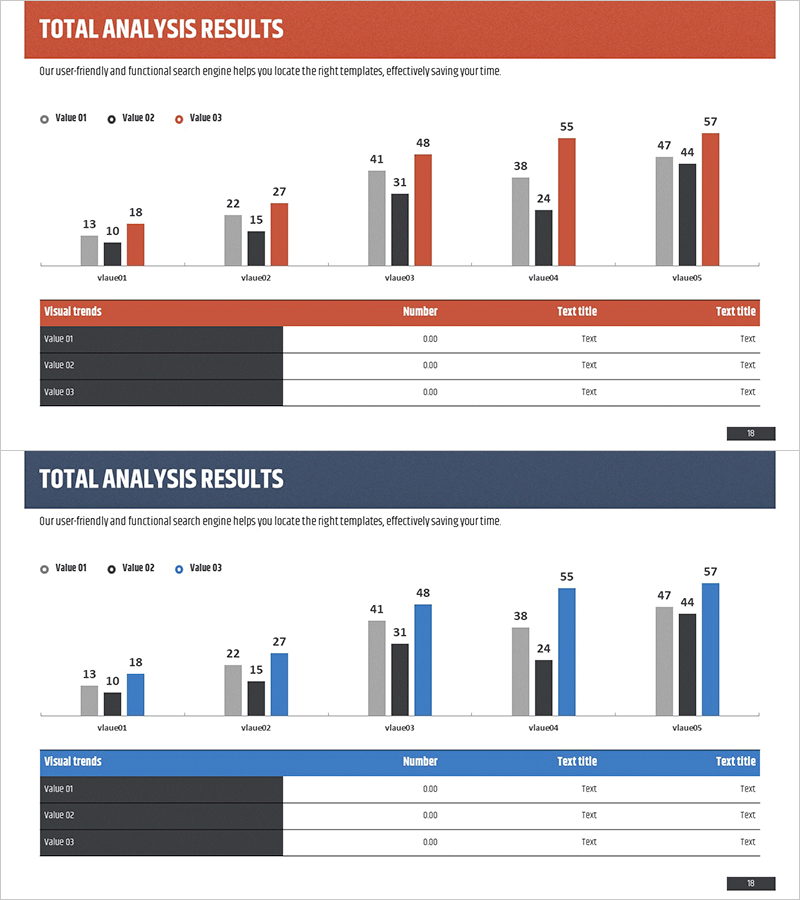
Customer Evaluation and Feedback Analysis Graph – Insights Centered on Customers
RM0200003_17
- Last Update 12/21/2025
- File Size 2.8MB
- # of Slides 2
- File Format PPTX
- Slide Ratio 16:9
- Color
Keywords
About the Product
This slide features a bar chart designed for visual analysis of customer evaluations and feedback. Its simple and intuitive design effectively conveys insights from potential and existing customers, making it an ideal decision-making tool for enhancing customer satisfaction. The combination of red and blue tones provides a strong yet professional appearance, especially suitable for showcasing customer success stories. Text and data replacements are easy, with an editing difficulty rated as 'easy'.
Related Products
-
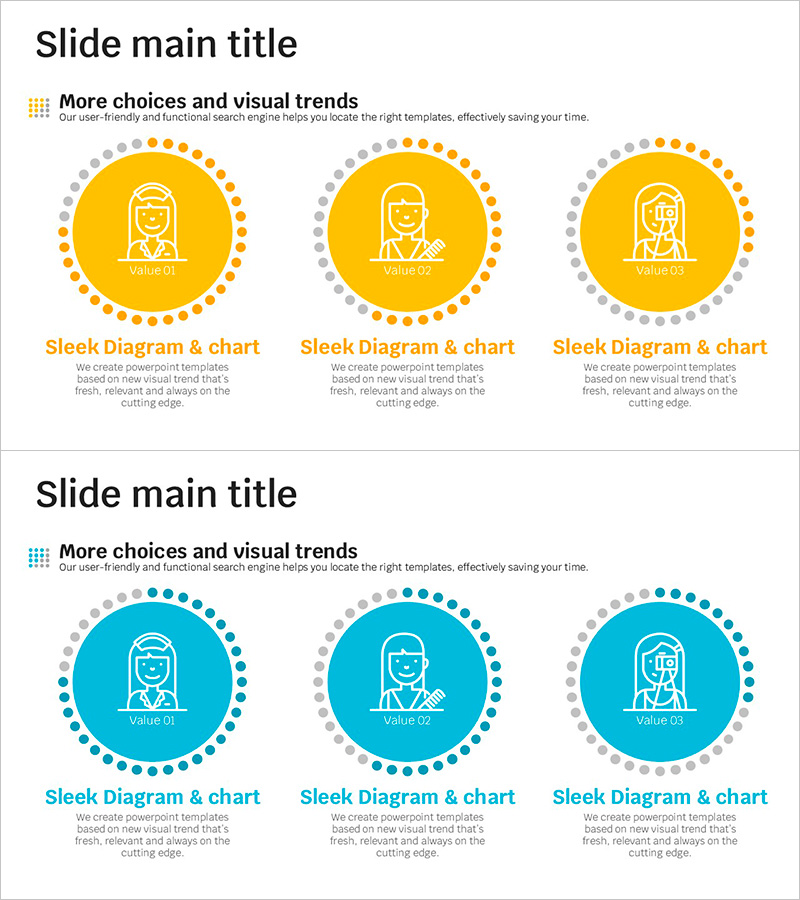
Circle Lights Diagram - Visualizing Organization and Operations
#Company Introduction #Operation Plan #Diagram
-
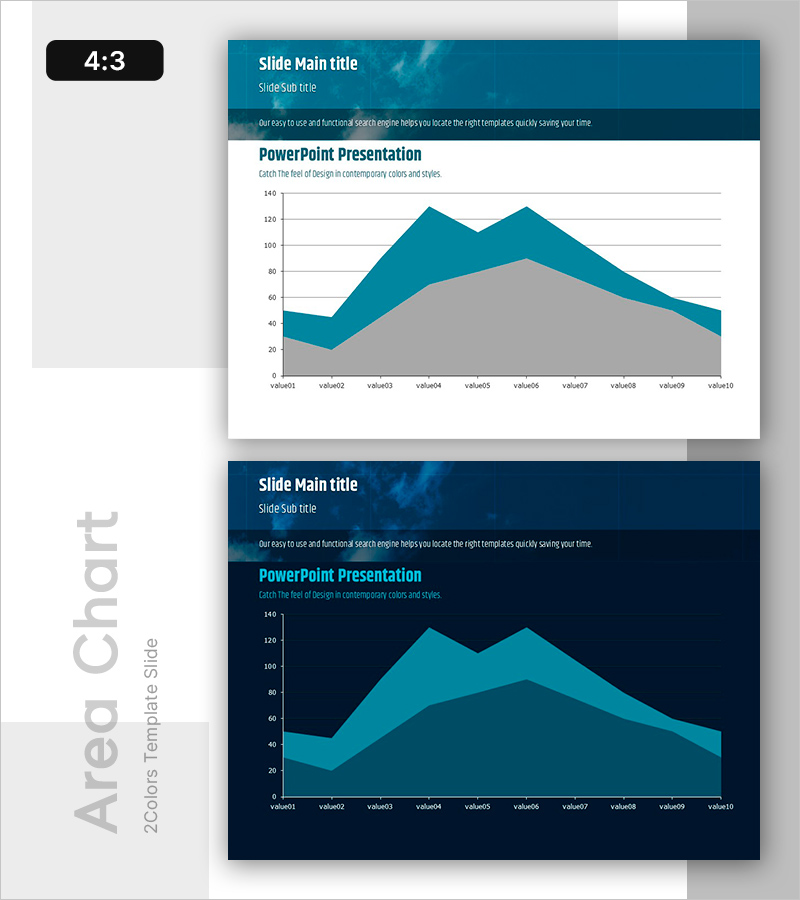
Visualizing Trends with Area Chart – Intuitive Analysis
#Graph
-

Social Network Program Overview – Key Messages Delivered with Stylish Design
#Product/Service #Diagram #Program Introduction
-
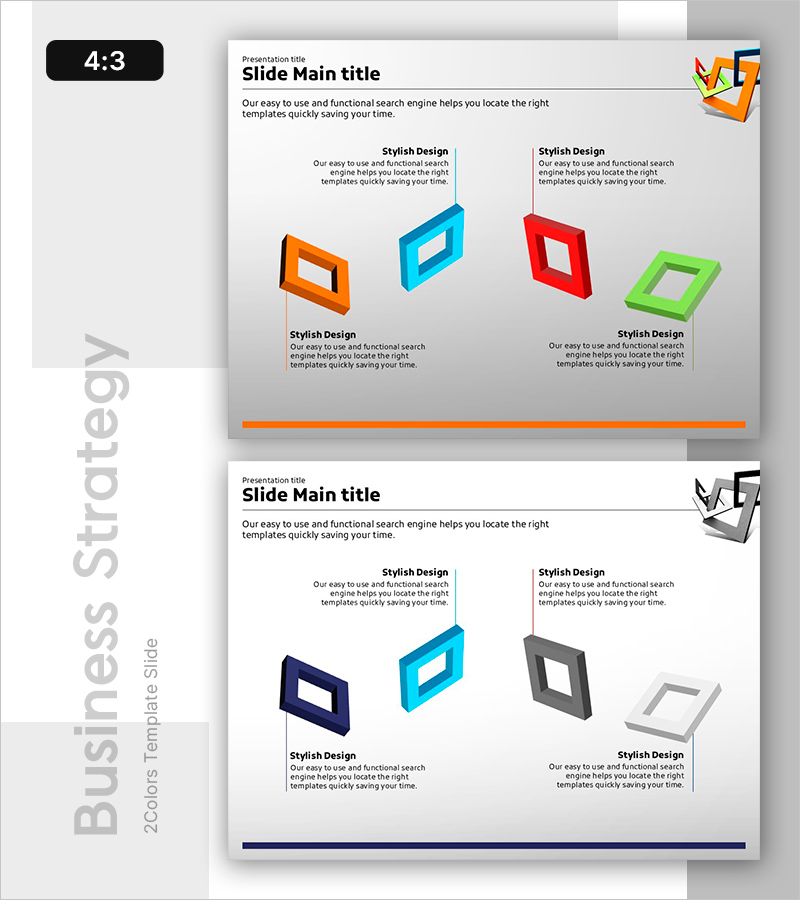
Structured Flow Through Frames – Business Strategy and Management
#Business Vision and Strategy #Business Management #Diagram
