Product/Service
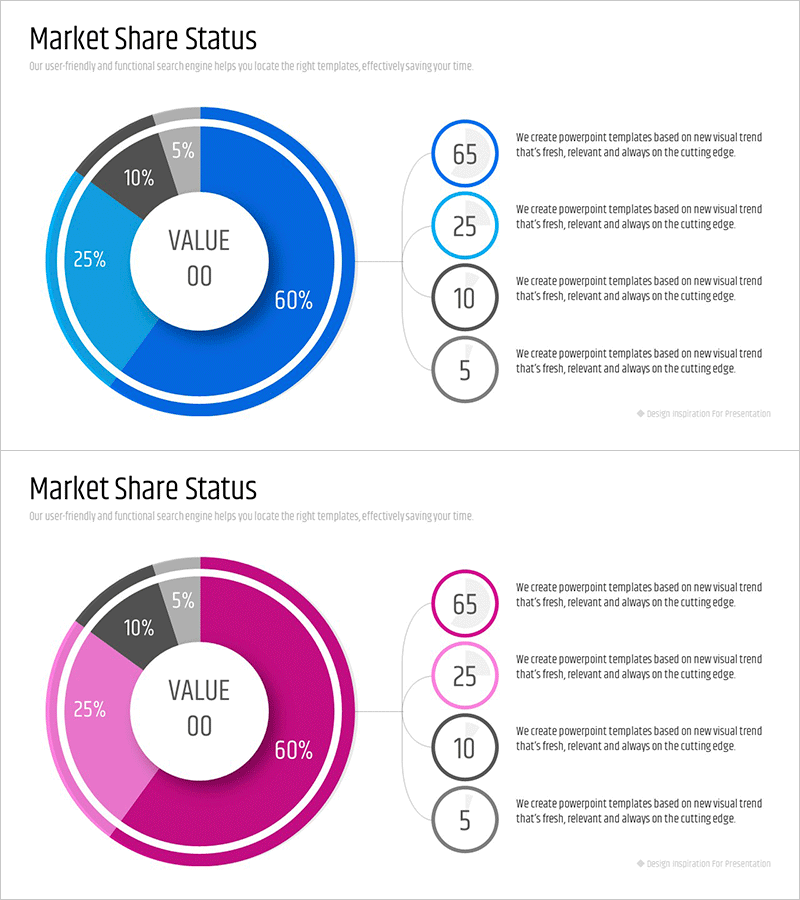
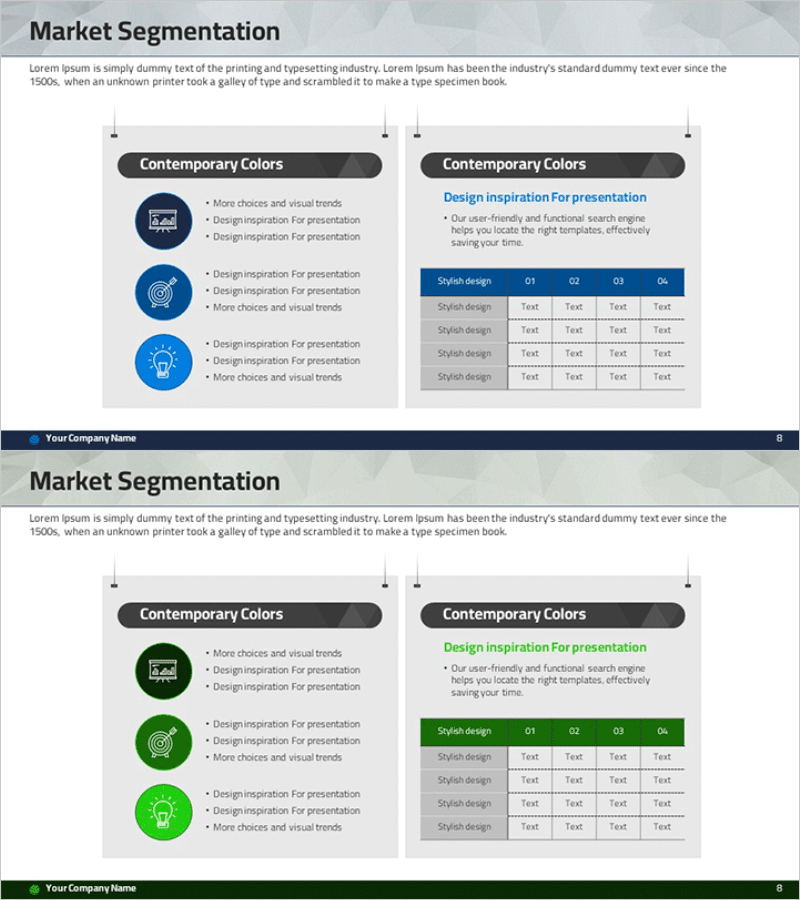
Market Share Analysis Graph – Efficient Data Visualization
RM0100018_11
- Last Update 12/21/2025
- File Size 1MB
- # of Slides 2
- File Format PPTX
- Slide Ratio 16:9
- Color
Keywords
About the Product
This slide features a donut chart designed to clearly analyze market share. The visually organized data structure allows for intuitive communication of business performance and market trends. With blue and red as the primary colors, the slide attracts attention and is easy to use in reports and proposals. Infused with the theme of 'efficient data visualization', it is suitable for various business scenarios, including market analysis reports, presentations, and corporate strategy meetings. The editing difficulty is rated as 'easy', allowing for quick customization across different presentation environments.
Related Products
-
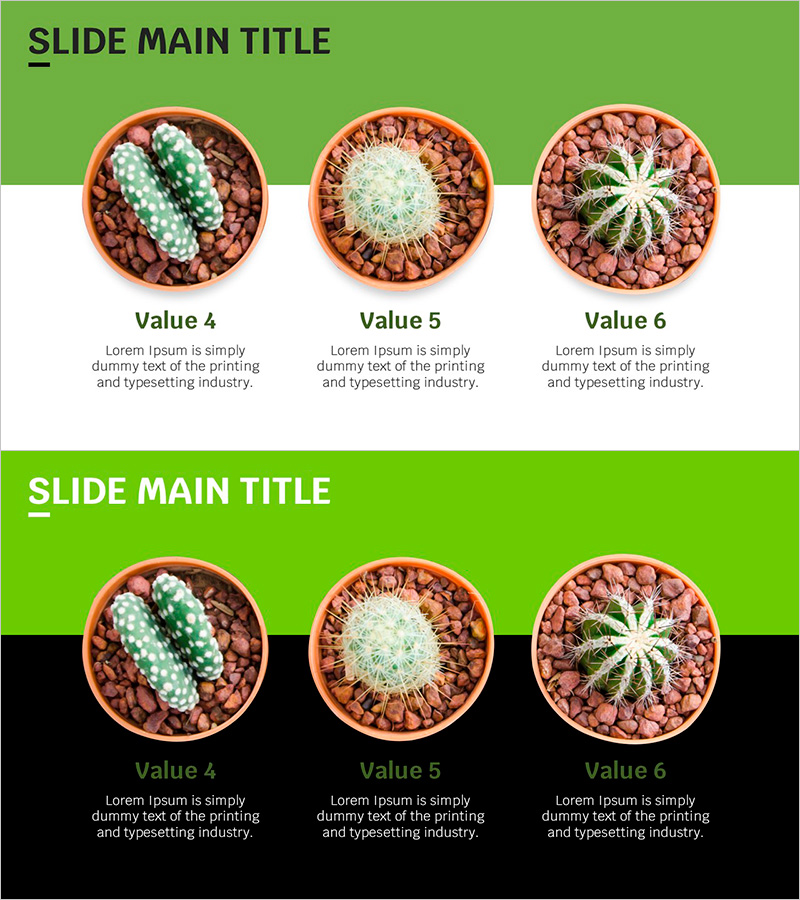
Trend Color Wide Template – Product and Service Introduction
#Product/Service #Technology Sector #Product and Service Overview
-
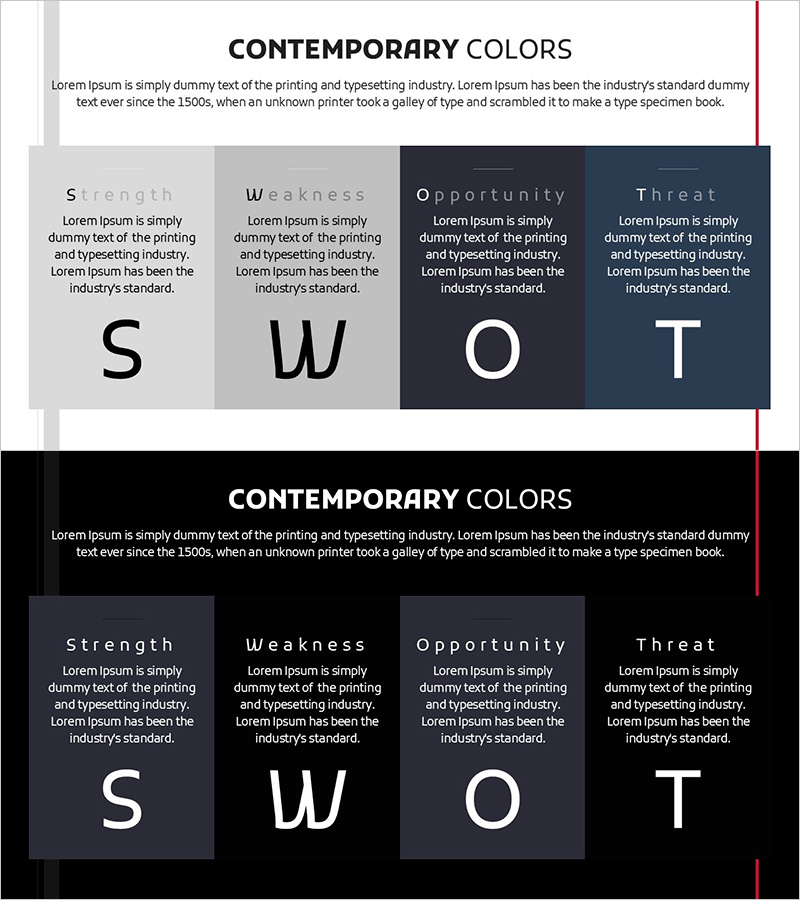
Dark Gray SWOT Analysis – Strengths and Weaknesses at a Glance
#Market and Competitor Analysis #Text Box #SWOT Analysis
-
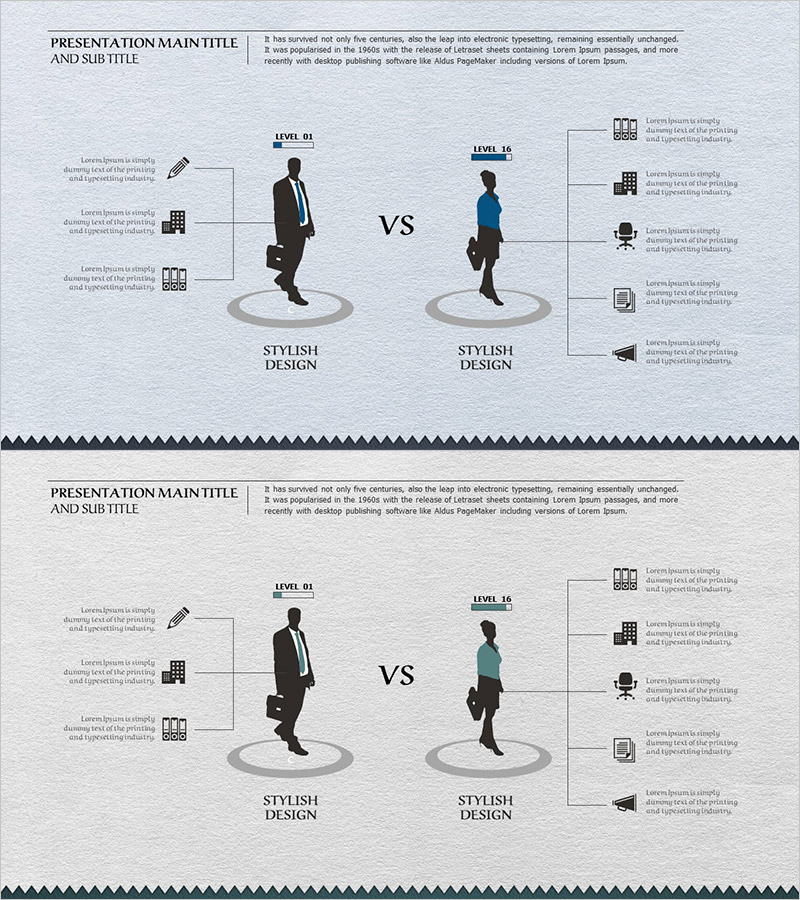
Comparison of Company Employee Job Fields – Understanding Diverse Roles of Employees
#Technology Sector #Market and Competitor Analysis #Diagram
-
Market Overview Analysis Slides – Insights & Data at a Glance
#Market and Competitor Analysis #Diagram #Market Analysis
