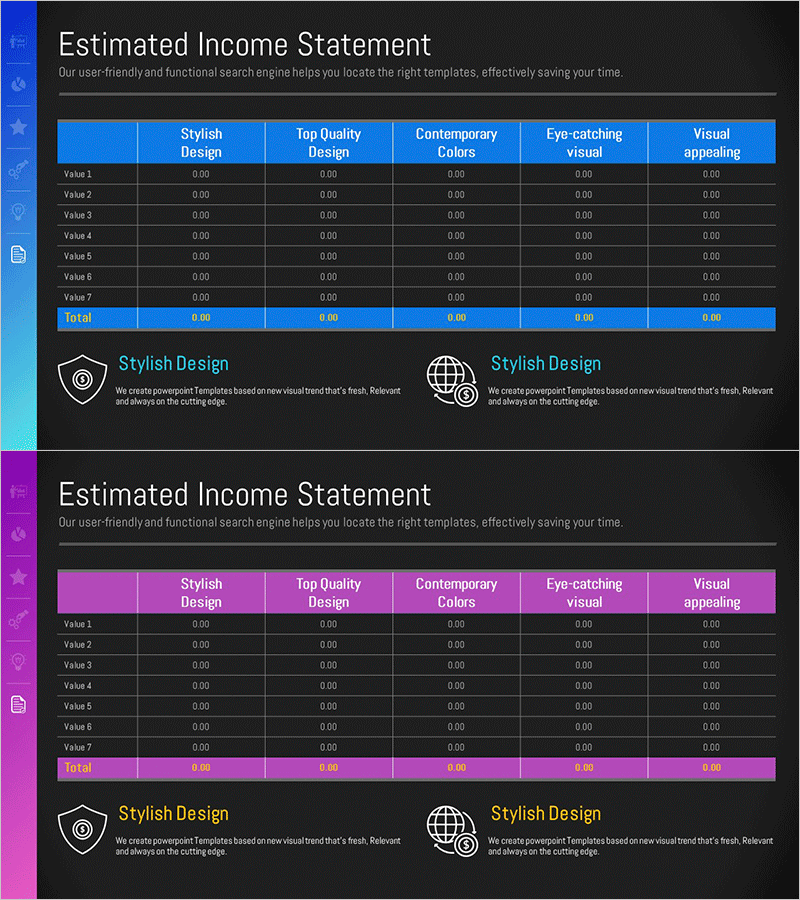
Financial Plans and Performance
Sales and Profit Diagram – Clear Financial Visualization
RM0100017_32
- Last Update 12/21/2025
- File Size 1MB
- # of Slides 2
- File Format PPTX
- Slide Ratio 16:9
- Color
Keywords
About the Product
This slide utilizes a sales and profit diagram to clearly visualize financial performance. It features a colorful combination and a simple layout, enabling intuitive data comparison. The harmonious use of blue and purple enhances credibility, making it suitable for meetings and financial reports. It can create a strong impression in scenarios like resource planning, budget reviews, and investment analysis. The editable data fields allow for easy replacement, with an editing difficulty rated as easy.
Related Products
-
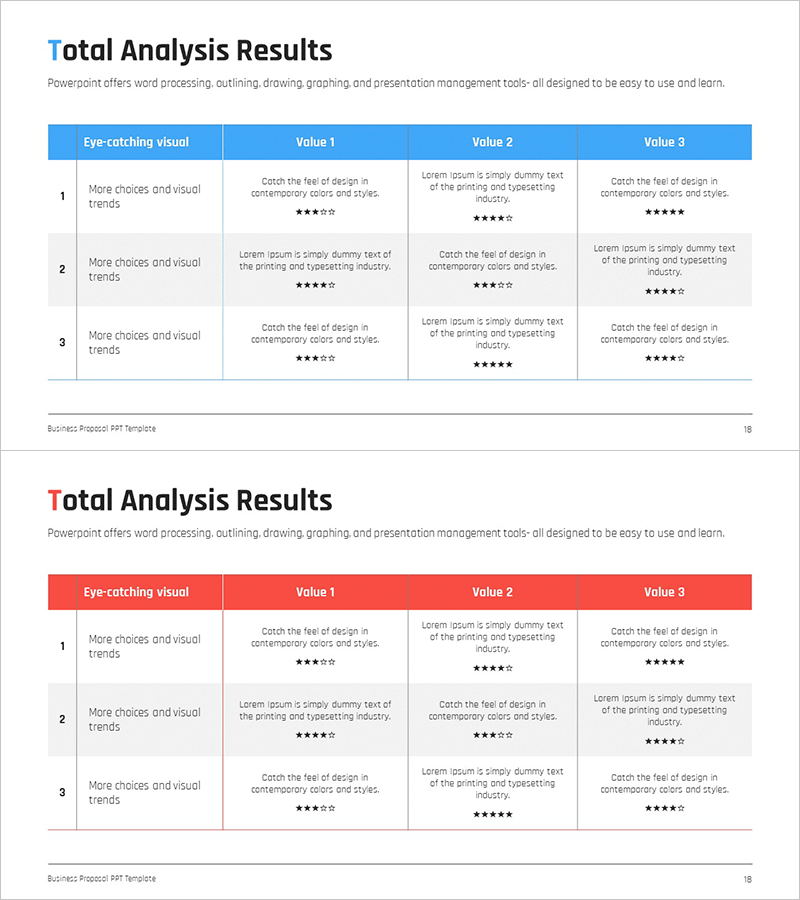
Feedback Evaluation Table – Visualization of Customer Success Cases
#Financial Plans and Performance #Customer Success Stories #Diagram
-
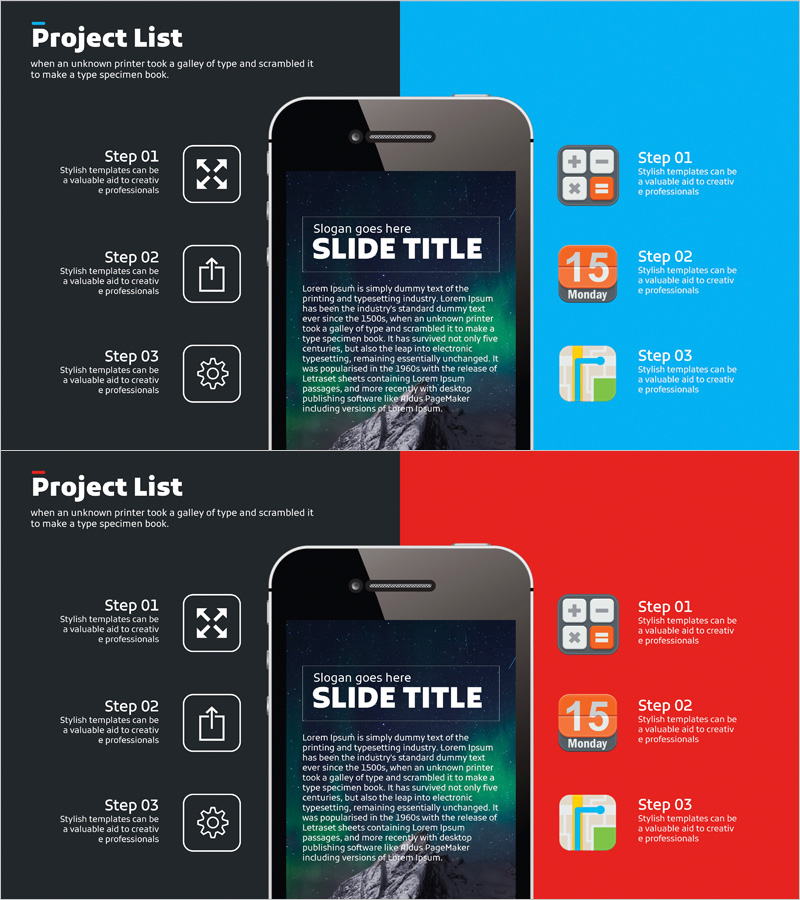
List of Mobile App Projects – Innovation and Creativity
#Product/Service #Diagram #Program Introduction
-

Adventure Business Global Map Indicator Analysis
#Marketing Plan and Strategy #Diagram #Other
-
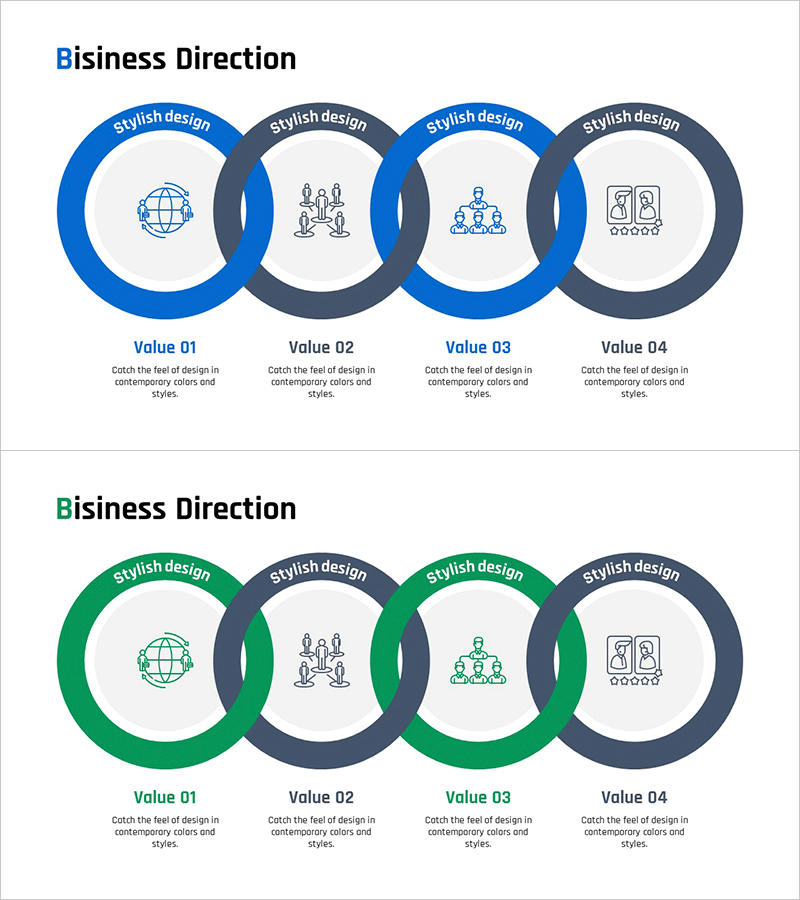
Connected Nested Circle Diagram – Visualizing Business Vision and Strategy
#Business Vision and Strategy #Diagram #Business Strategy
