Market and Competitor Analysis
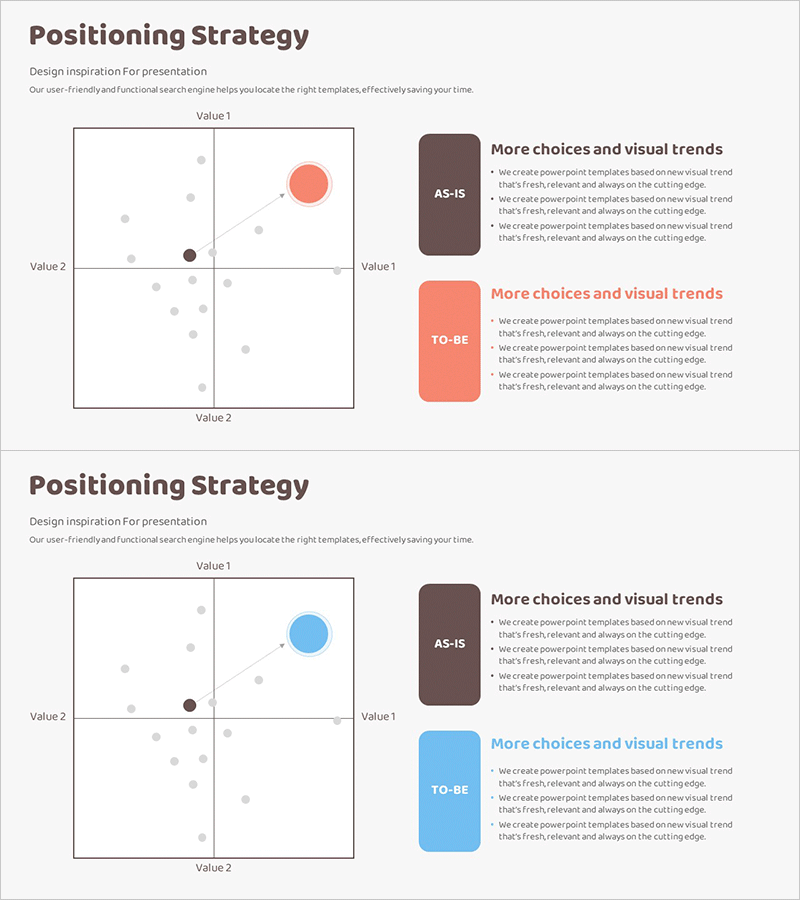
Positioning Area Graph – Essential Slide for Market Analysis
RM0100016_25
- Last Update 12/21/2025
- File Size 0.3MB
- # of Slides 2
- File Format PPTX
- Slide Ratio 16:9
- Color
Keywords
About the Product
This slide features an area graph for visually representing positioning strategies. It distinctly showcases the current positioning of brands or products in 'AS-IS' and future targets in 'TO-BE'. The dynamic color combination of red, blue, and brown enhances visual appeal while providing clear data representations, making it invaluable for competitor analysis and marketing strategy development. It serves as a powerful visual aid for presentations requiring market positioning and trend analysis.
Related Products
-

Traffic Accident Ratio Infographic by Region – Data Visualization
#Company Introduction #Market and Competitor Analysis #Other
-

Introduction to the Green Union – Your Partner in Environmental Protection
#Company Introduction #Diagram #Manpower
-
Introduction to Business History – Utilizing a Cluster Diagram
#Company Introduction #Diagram #History
-
Astronomy Research Step-by-Step Schedule – Systematic Implementation Strategy
#Business Promotion Strategy #Business Management #Diagram
