Business Promotion Strategy
Product Sales Status Chart – Effective Data Visualization
RJ0900034_5
- Last Update 12/21/2025
- File Size 0.3MB
- # of Slides 2
- File Format PPTX
- Slide Ratio 16:9
- Color
Keywords
About the Product
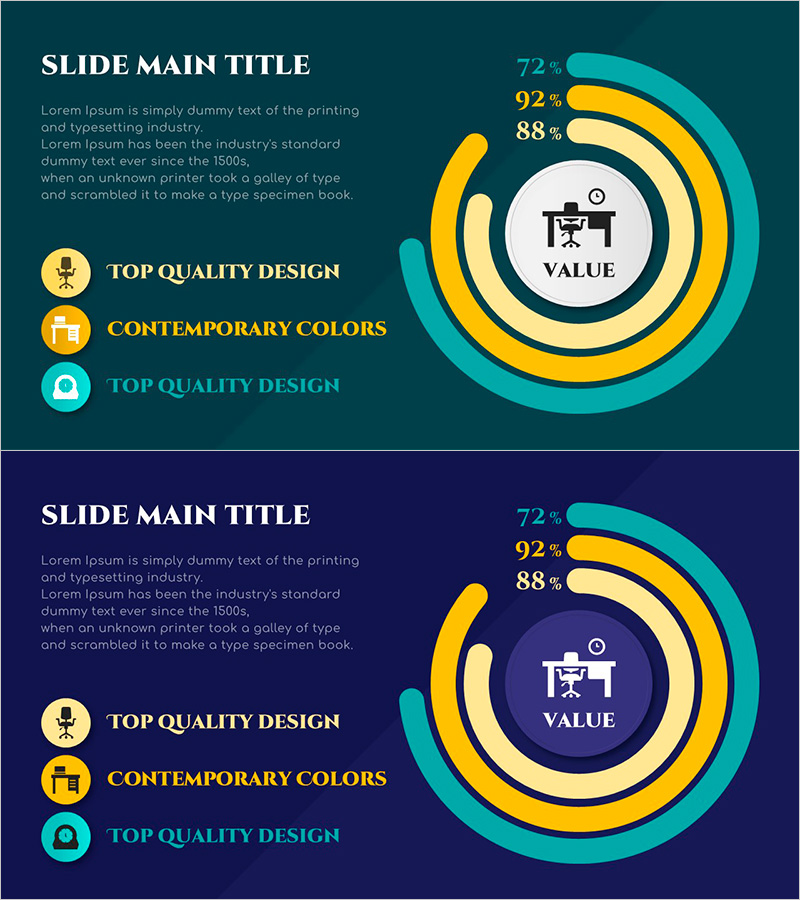
This slide features a chart that visually represents product sales status, making it useful for clearly conveying business performance. The contemporary color palette of teal, yellow, and purple emphasizes the importance of the information while the clustered graph design allows for easy comparison of sales data. Users can effectively utilize this slide to communicate business strategies, competitive analysis, and performance-related information. It offers simple editing capabilities and is rated as an easy editing slide, allowing for quick customization with text and graph replacements.
Related Products
-
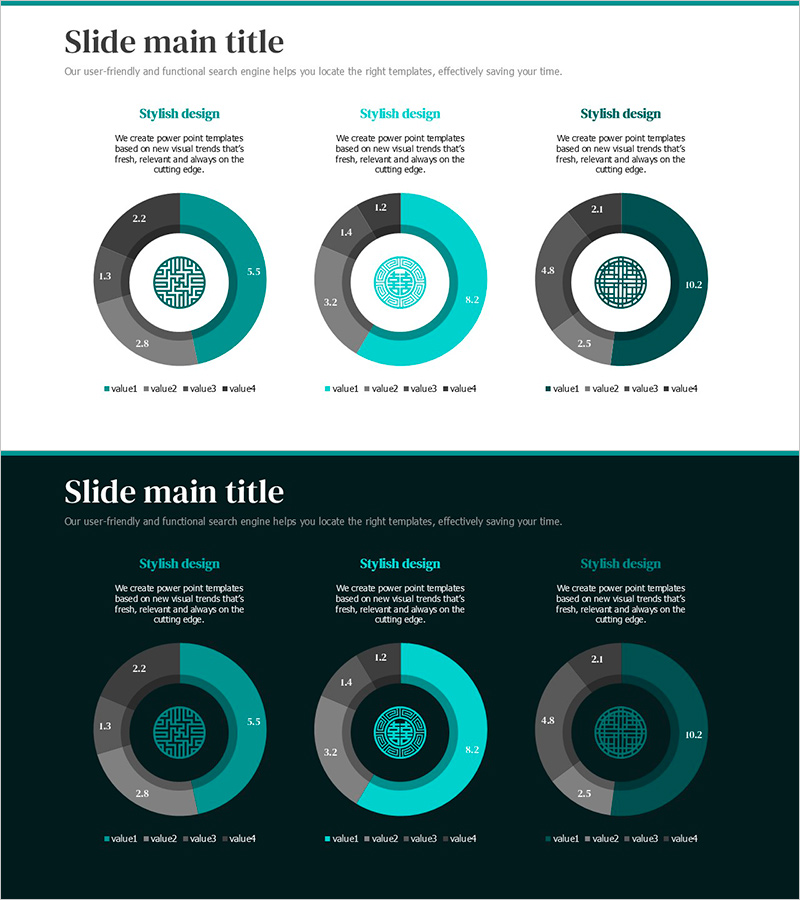
Visualization of Traditional Items Proportion – Market Share Analysis
#Company Introduction #Market and Competitor Analysis #Graph
-
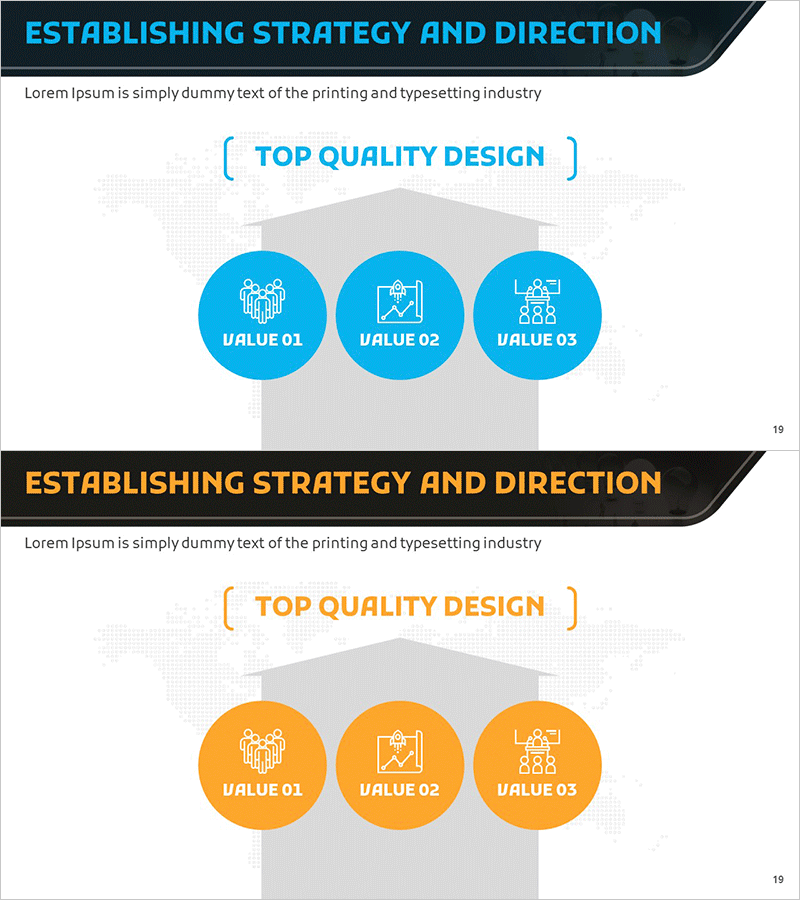
Visualizing Global Business Strategy Goals – Presenting Data-Driven Vision
#Business Vision and Strategy #Marketing Plan and Strategy #Diagram
-
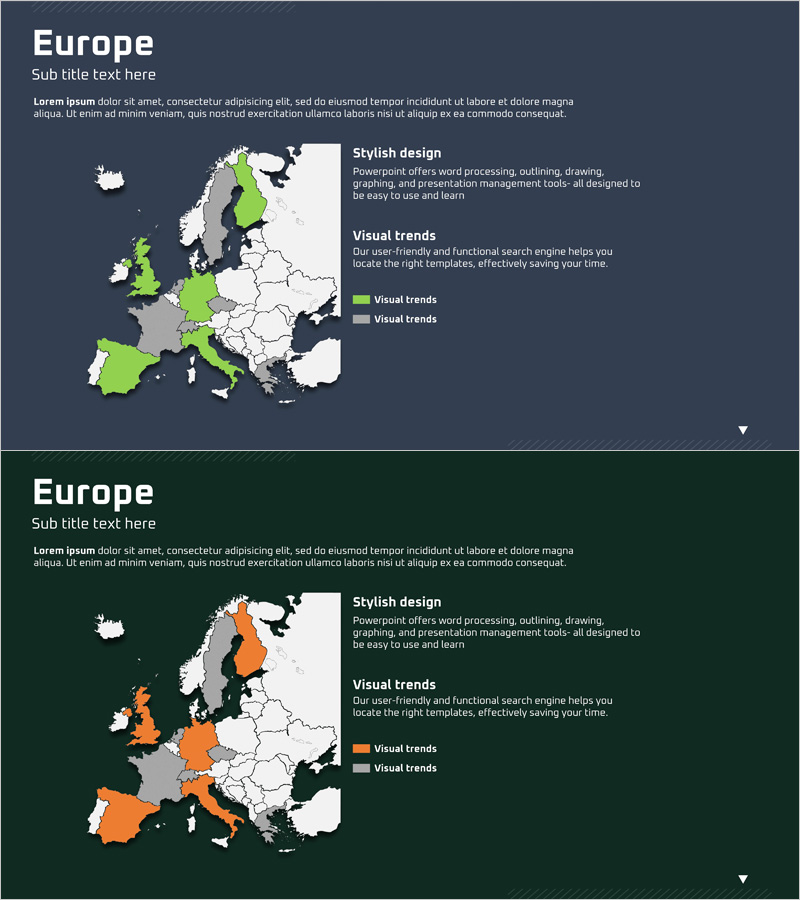
European Target Country Analysis Map – Market and Competitor Analysis
#Market and Competitor Analysis #Marketing Plan and Strategy #Other
-
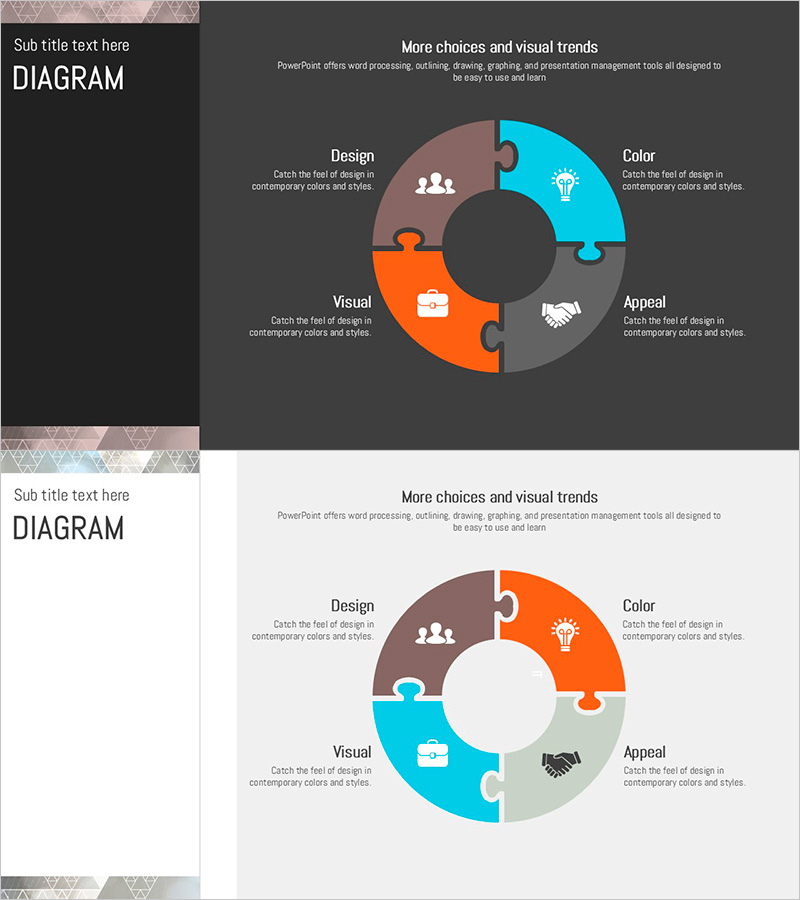
Triangular Pattern Presentation Template DIAGRAM1 – Diagram for Business Introduction
#Business Introduction #Business Promotion Strategy #Diagram
