Market and Competitor Analysis
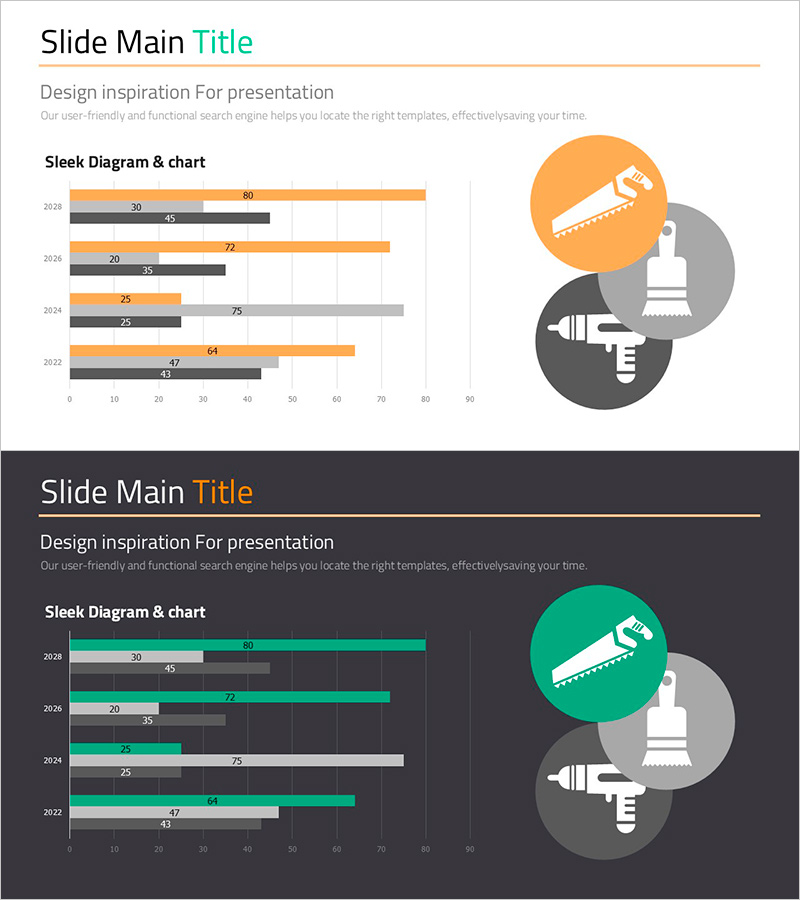
Horizontal Bar Chart for Construction Project Performance Analysis – Stability and Growth
RJ0900017_21
- Last Update 12/21/2025
- File Size 0.3MB
- # of Slides 2
- File Format PPTX
- Slide Ratio 16:9
- Color
Keywords
- #Content-Based Slides
- #Design-Based Slides
- #Market and Competitor Analysis
- #Diagram
- #Graph
- #Market Analysis
- #Competitive Advantage
- #Cluster
- #Horizontal Bar
- #Combination Diagram
- #Grouped Horizontal Bar
- #16:9
- #horizontal bar chart
- #construction project performance
- #market analysis
- #competitive advantage
About the Product
This slide utilizes a horizontal bar chart to clearly analyze construction project performance trends. The layout is simple yet structured, featuring a color scheme of green and orange that conveys stability and vitality. Its cluster design makes data comparison and analysis easy, suitable for evaluating project outcomes and market competitiveness. This design is particularly ideal for software or business proposals. Text and data fields can be easily replaced, with an overall editing difficulty rated as 'medium'.
Related Products
-
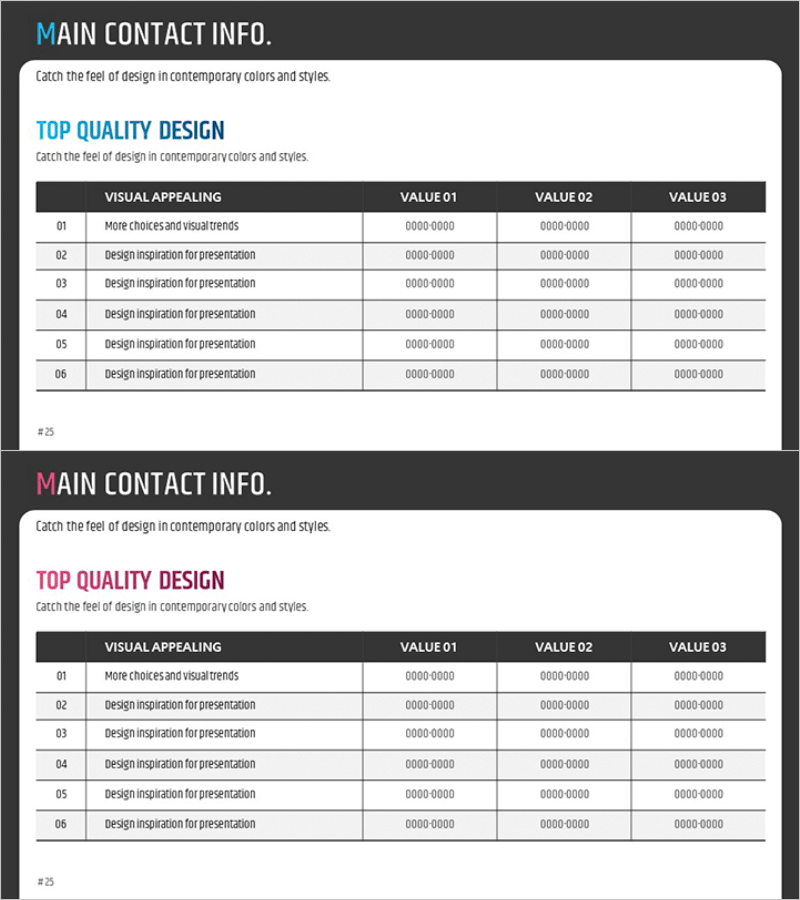
Table of Main Business Contacts – Trusted Business Network
#Company Introduction #Business Introduction #Business Vision and Strategy
-
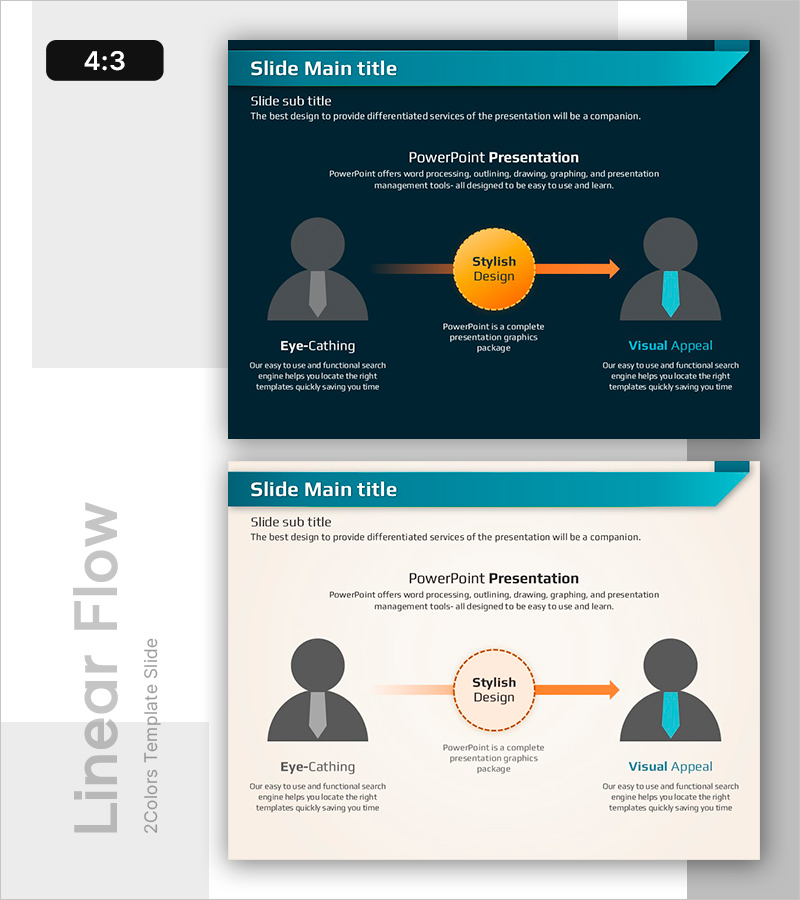
Target Customer Strategy – Attractive Service Delivery Flow
#Product/Service #Marketing Plan and Strategy #Diagram
-
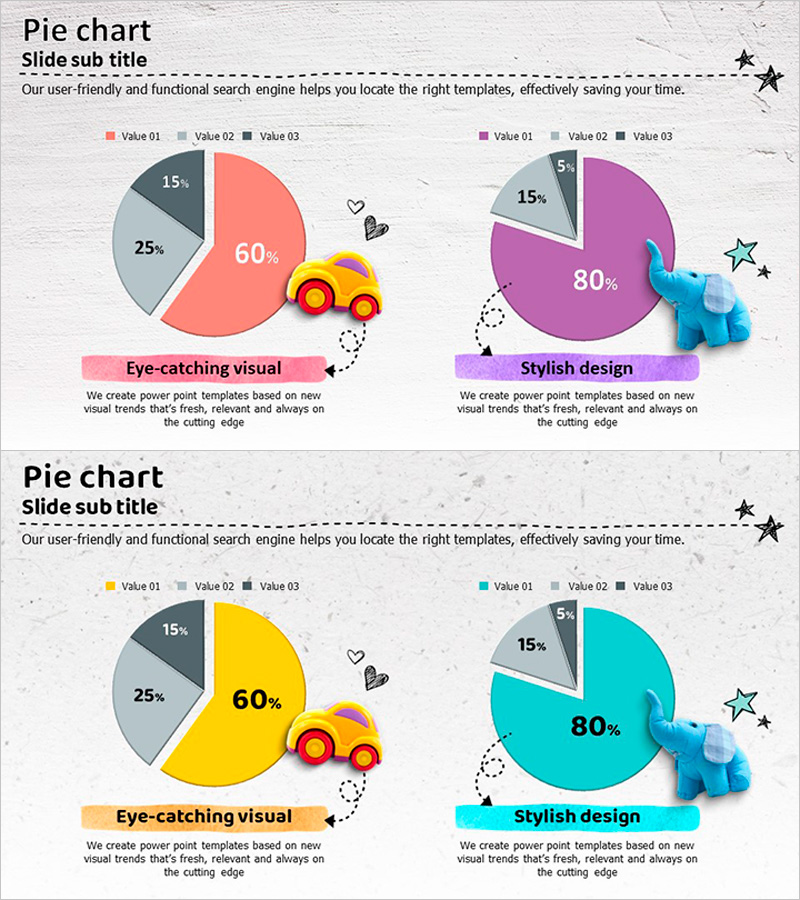
Toys and Pie Chart Analysis – Visual Data for Customer Insights
#Market and Competitor Analysis #Graph #Customer Analysis
-

Graph Trend Line Blue Gray for Market Outlook Visualization – Clean and Stylish Design
#Company Introduction #Market and Competitor Analysis #Diagram
