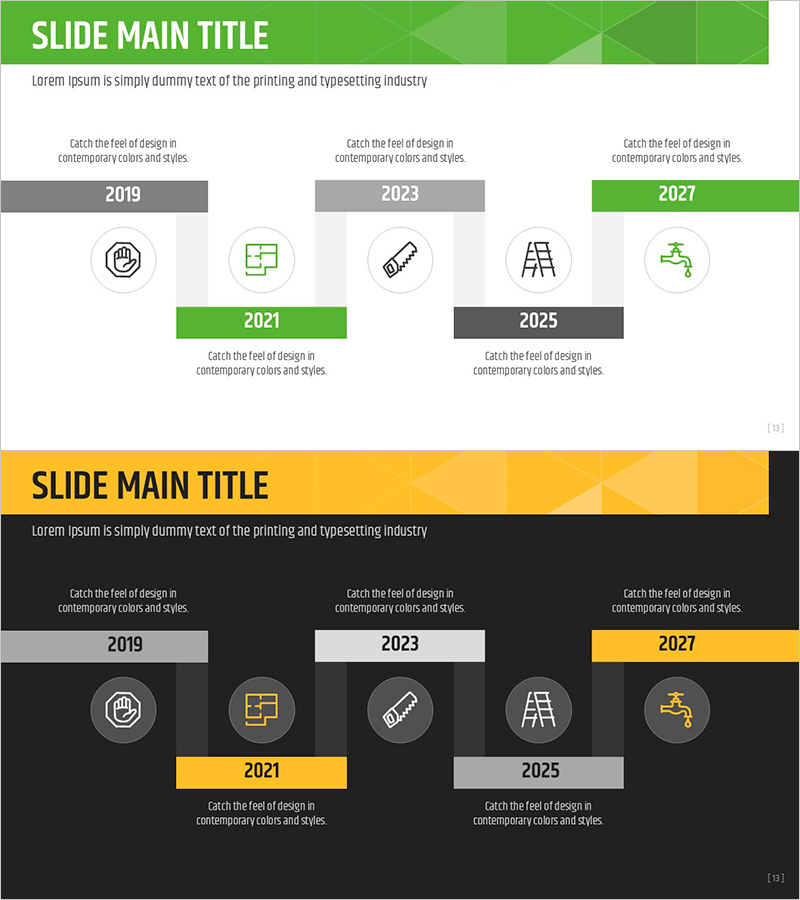
Business Promotion Strategy
Task Propulsion Schedule Diagram - Visualization of Business Plans and Strategies
RJ0900015_12
- Last Update 12/21/2025
- File Size 0.5MB
- # of Slides 2
- File Format PPTX
- Slide Ratio 16:9
- Color
Keywords
About the Product
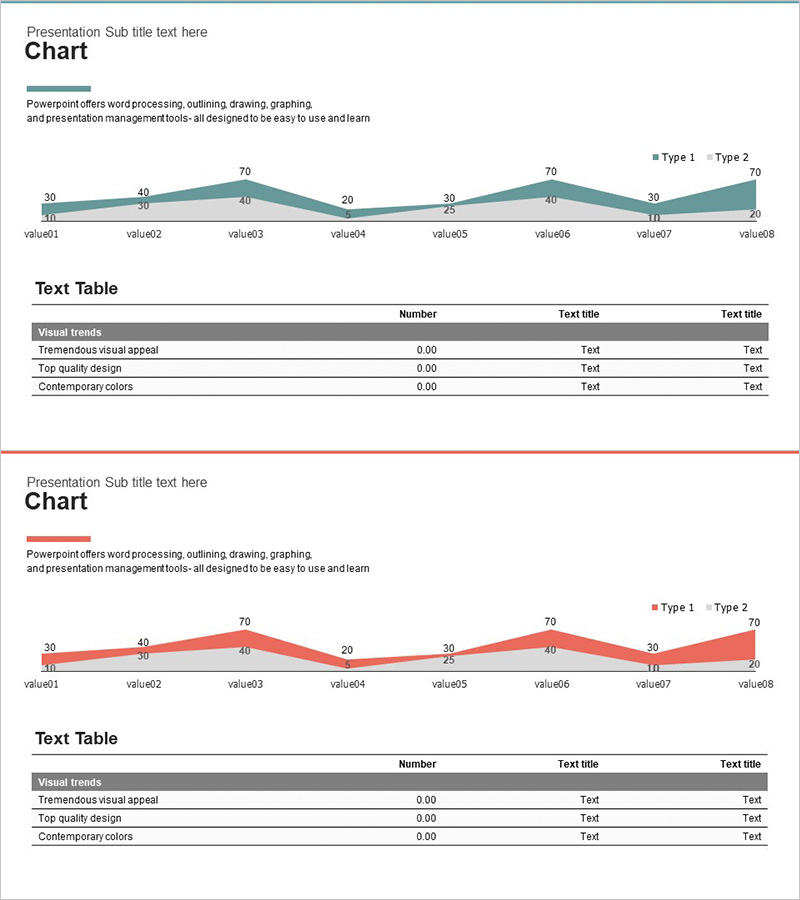
This slide utilizes a task propulsion schedule diagram to visually represent business strategies and key timeline plans. The diagram structure features a clear layout that shows progress by year, using green and yellow to convey a positive and dynamic image. It aids corporate practitioners and professionals in the education and research fields to facilitate smooth communication regarding timeline management. It is especially useful for clarifying project progress. Text and icons are easy to replace with an average editing difficulty, making it suitable for various project presentations.
Related Products
-
Carbon Neutral Solution Connection Diagram
#Operation Plan #Diagram #Risk Management
-
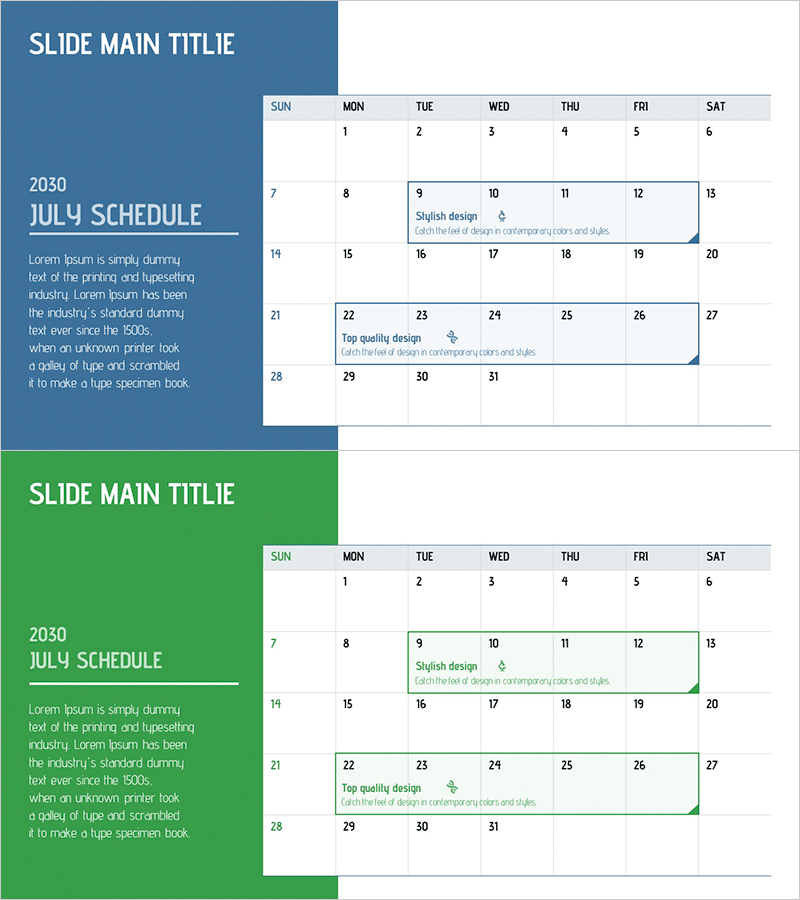
Modern Design July 2030 Schedule Slide – Quality and Style
#Operation Plan #Diagram #Business Promotion Schedule
-
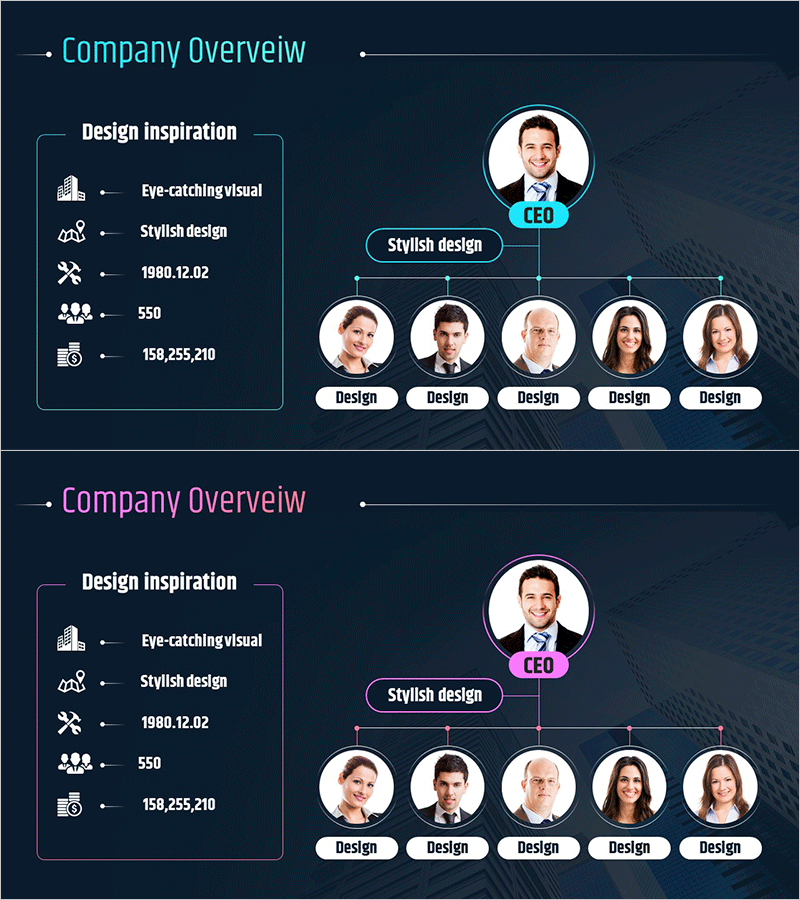
Business Deck Layout – Company Overview and Business Outline
#Company Introduction #Business Introduction #Business Vision and Strategy
-
Competitor Analysis Graphs & Tables – Delivering Market Insights
#Market and Competitor Analysis #Diagram #Graph
