Emotional Messages
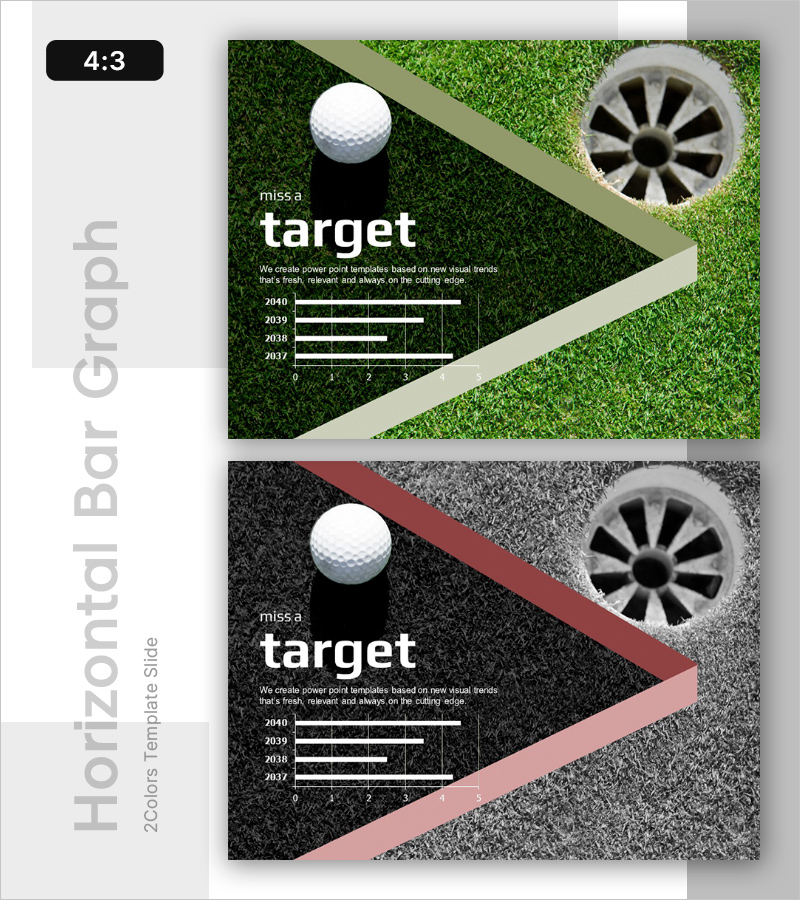
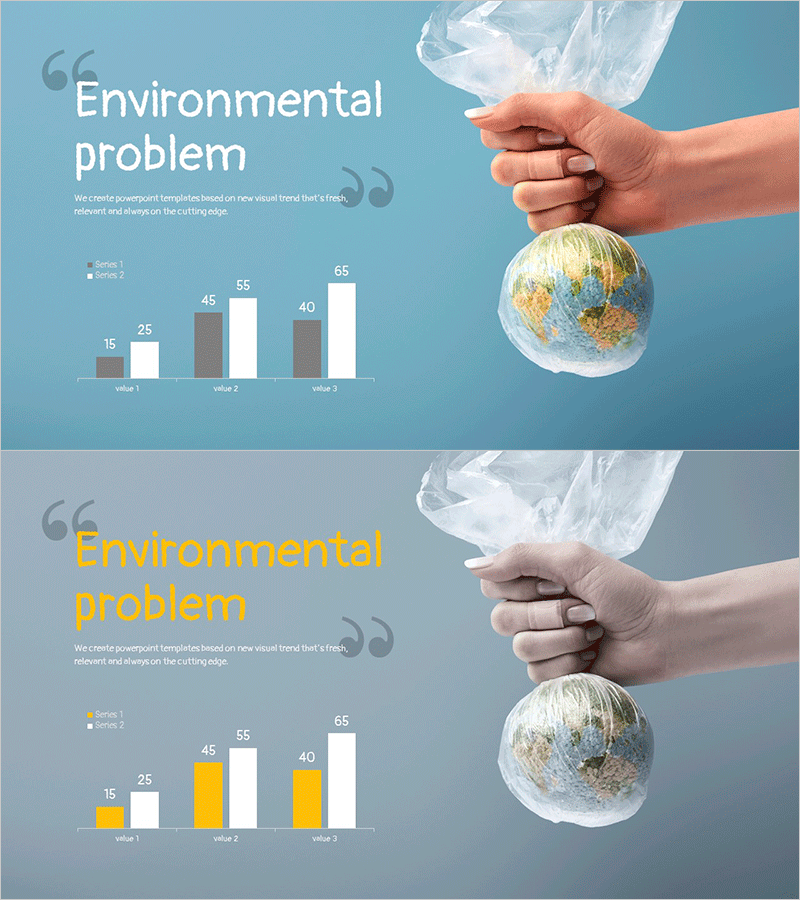
Bar Graph Analyzing Global Environmental Issues
RL0100095_2
- Last Update 12/21/2025
- File Size 3.7MB
- # of Slides 2
- File Format PPTX
- Slide Ratio 4:3
- Color
Keywords
About the Product
This slide features a bar graph visually analyzing global environmental issues. Its goal is to clearly convey the severity of these environmental concerns through visual data comparison. The harmonious color scheme of blue, gray, and yellow provides both reliability and urgency, effectively representing the data. This slide is particularly useful for market and competitor analysis regarding environmental issues. It is well-suited for corporate practitioners, public sector officials, and non-profit representatives, contributing significantly to data-driven decision making and strategy building. The slide is easy to edit, allowing for quick replacement of graphs and text, rated 'easy' for practical use.