Market and Competitor Analysis
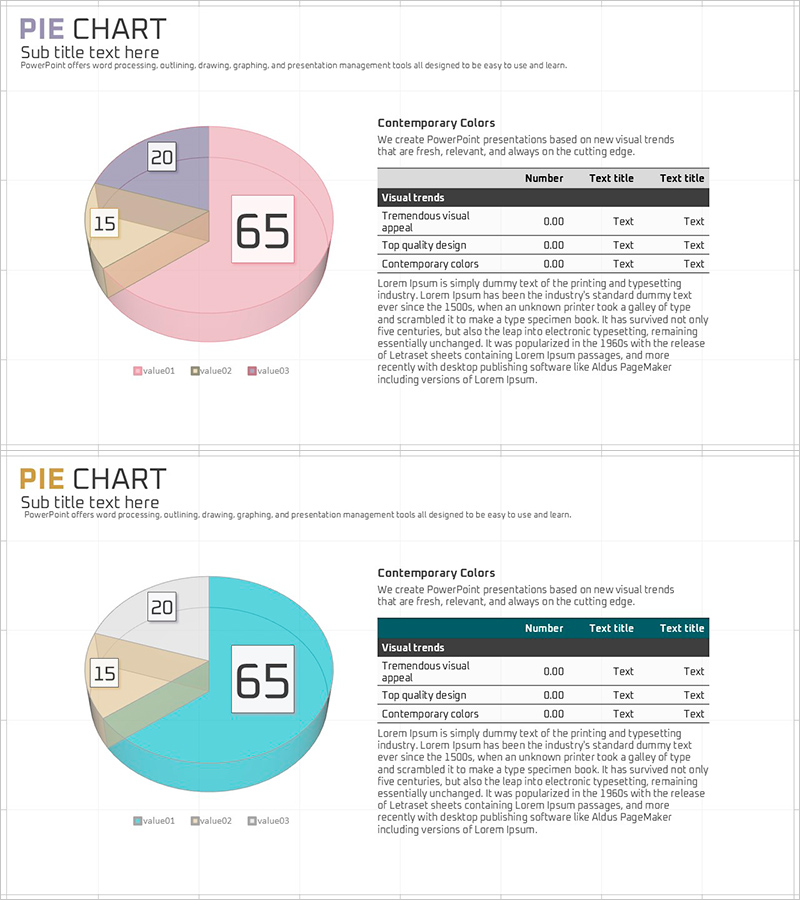
Visualizing Market Analysis with Table and 3D Pie Chart
RJ0900009_9
- Last Update 12/21/2025
- File Size 0.1MB
- # of Slides 2
- File Format PPTX
- Slide Ratio 16:9
- Color
Keywords
About the Product
This PowerPoint slide effectively visualizes market share and revenue realization using tables and a 3D pie chart. Various hues enhance information clarity while benefiting financial planning and performance presentations. Notably, the turquoise, red, and orange colors maximize visual impact, and the clean, modern design effectively emphasizes data. This slide is particularly suited for conveying research results or reports.
Related Products
-
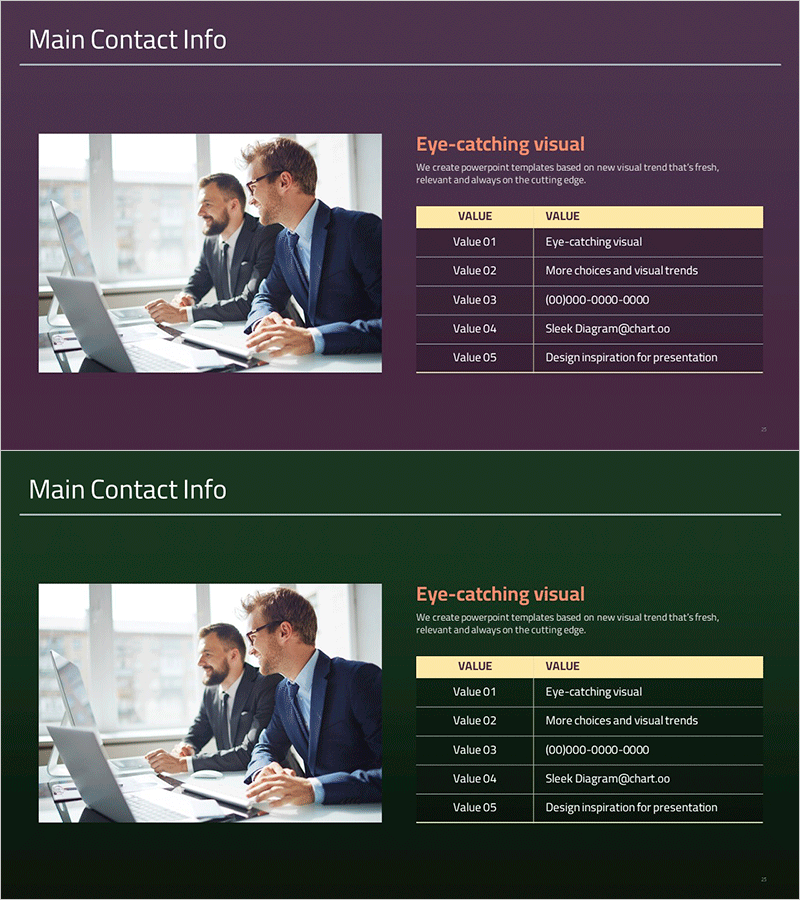
Company Profile Summary Table – Emphasizing Professionalism
#Company Introduction #Diagram #Company Overview
-
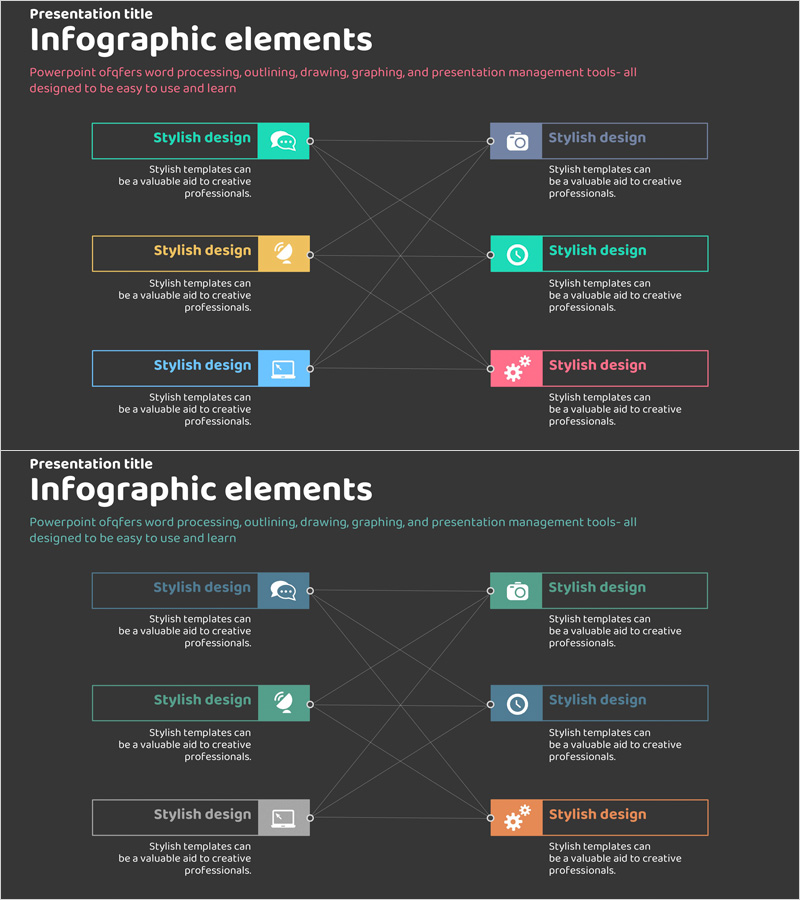
Business Areas and Fields – Diagram Slide with Clusters and Connections
#Business Introduction #Diagram #Business Areas
-
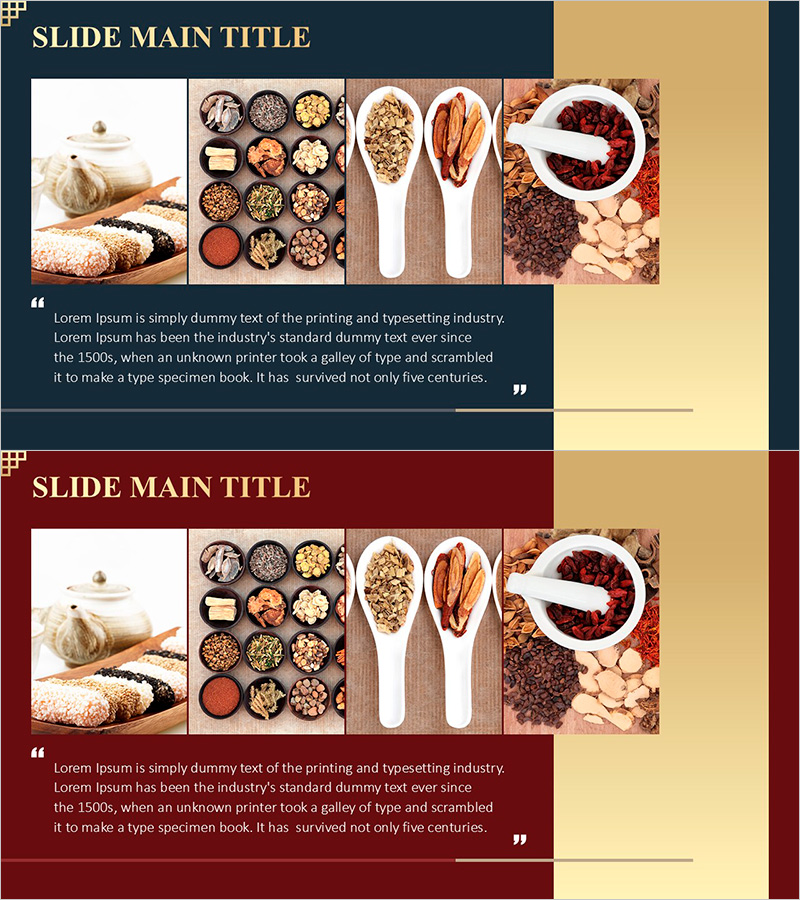
Korean Traditional Food Ingredients Introduction Cluster Diagram
#Product/Service #Diagram #Product/Service Introduction
-
Key Marketing Strategy Diagram
#Product/Service #Marketing Plan and Strategy #Diagram
