Business Areas and Fields – Diagram Slide with Clusters and Connections
RJ0400010_13
- Last Update 05/19/2025
- File Size 0.2MB
- # of Slides 2
- File Format PPTX
- Slide Ratio 16:9
- Color
Keywords
About the Product
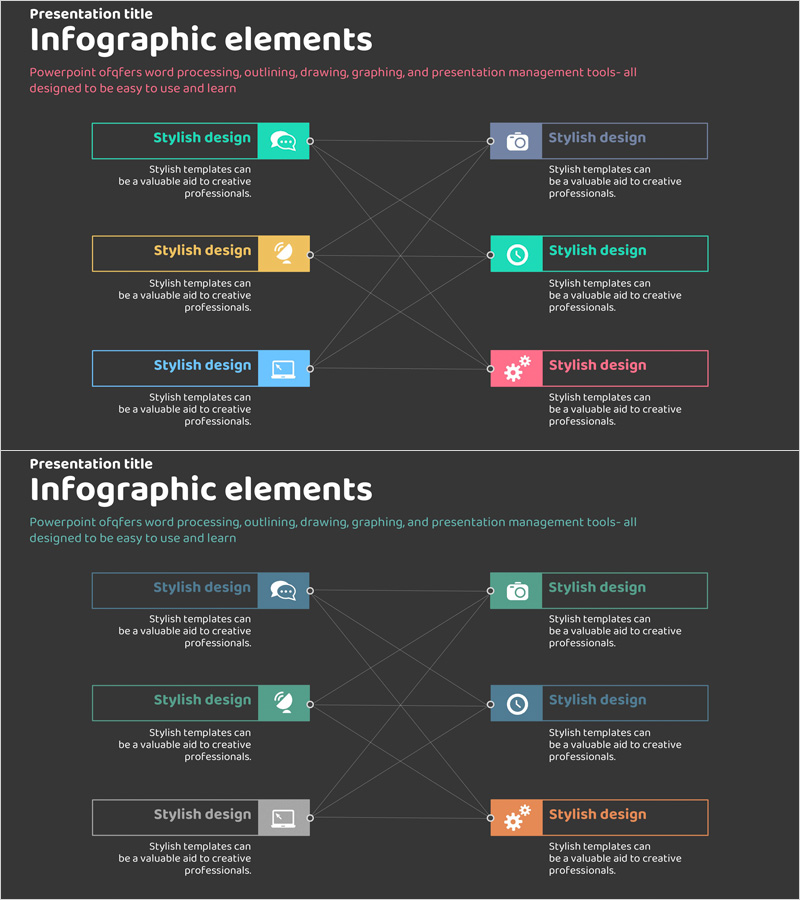
A cluster connection diagram PowerPoint slide that visualizes relationships between business areas and fields. Set against a dark background, this slide features six colorful icons and text boxes arranged in an interconnected network structure. The hub-and-spoke layout effectively communicates business portfolios, cross-organizational collaboration, system integration, and service ecosystems. The 2-slide presentation is ready to use immediately, with fully editable nodes, icons, and connecting lines for customization.
Usage Points
-
Main Usage
Illustrate interconnected relationships between multiple business elements, organizational units, or system components. The hub-and-spoke structure clearly establishes hierarchy between core concepts and peripheral elements, making it ideal for business strategy presentations, organizational structure explanations, and technology architecture overviews.
-
How to Use
Replace node text with business division names, organizational units, or system names. Customize icons to represent each area's characteristics. Adjust connection line colors and thickness to indicate relationship strength. During presentation, highlight each node sequentially to guide audience understanding through the network structure.
-
Recommended For
Executives, business development teams, marketing professionals, IT architects, and organizational development specialists. Suitable for business strategy presentations, organizational structure explanations, technology system introductions, partnership relationship descriptions, and portfolio composition presentations.
-
Slide Structure
2-slide set with dark charcoal background. Each slide displays six color-coded icons (teal, orange, blue, pink, yellow, red) with editable text boxes in a cluster connection layout. Central hub connects to surrounding nodes via bidirectional arrows. All nodes are grouped for independent editing and repositioning.
Related Products
-

Global Business Areas Diagram – Business Visualization
#Product/Service Introduction #Business Introduction #Diagram
-

IT Business Plan Connection Diagram – Focus on Cluster and Connections
#Business Introduction #Business Strategy #Diagram
-

Key Competitors and Differentiation Strategies – Effective Cluster Analysis
#Business Introduction #Market and Competitor Analysis #Diagram
-

Circular Puzzle Diagram – Infographic for Business Introduction
#Company Introduction #Business Introduction #Diagram
