Diagram
Visualizing Design Trends with Table Format – Green Orange
RJ0800015_17
- Last Update 12/21/2025
- File Size 1.6MB
- # of Slides 2
- File Format PPTX
- Slide Ratio 16:9
- Color
Keywords
About the Product
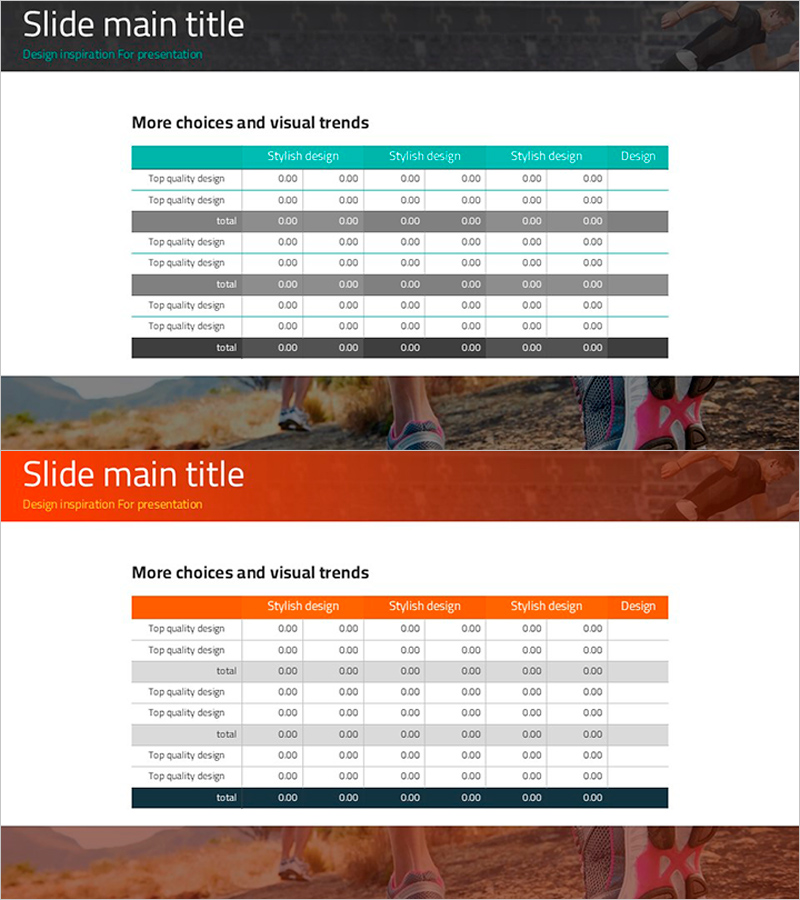
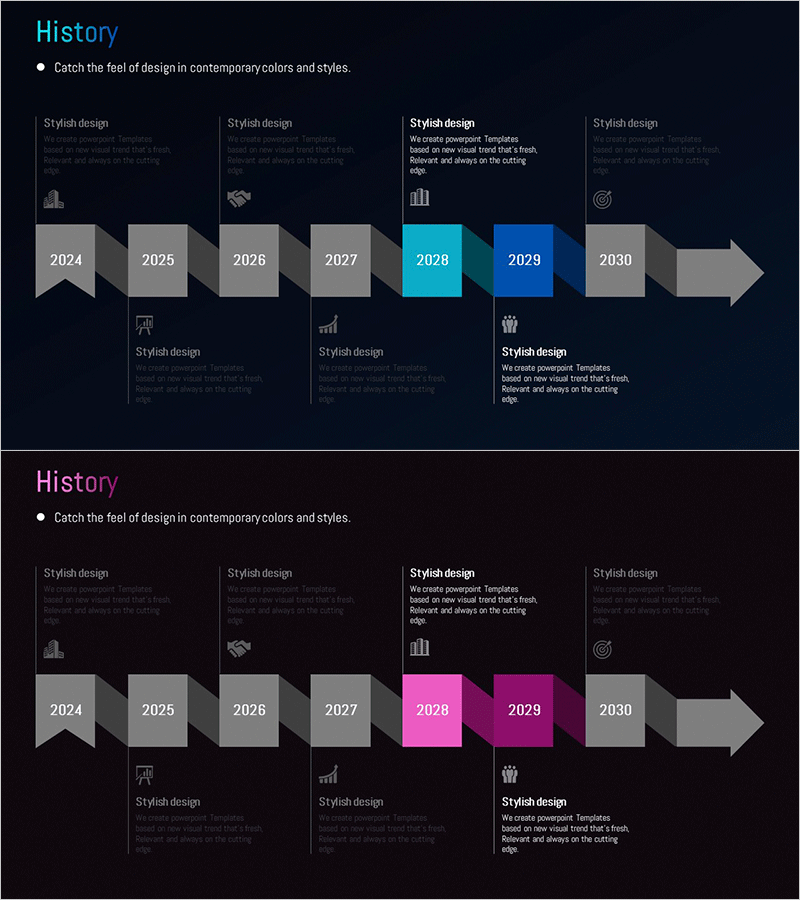
This slide utilizes a table format to clearly visualize various design trends. The areas feature a blend of teal and orange, designed to make the data visually prominent. The format is concise and modern, facilitating easy understanding of complex data. It is applicable in various situations like marketing, management analysis, and design meetings, making it effective for reports with emphasized numerical data. This slide has an editing difficulty rated as 'easy', allowing users to customize quickly through simple text and data field replacement.
Related Products
-
Big Data Business Differentiation Strategy - Innovation through Data
#Product/Service #Business Vision and Strategy #Diagram
-
Cloud Closure Diagram – Vision and Strategy
#Business Vision and Strategy #Business Promotion Strategy #Diagram
-
Introduction to the Food Judges – Team Introduction Slide
#Company Introduction #Diagram #Manpower
-
Arrow Connection History Diagram – Step-by-Step Business Strategy
#Company Introduction #Business Promotion Strategy #Diagram
