Product/Service
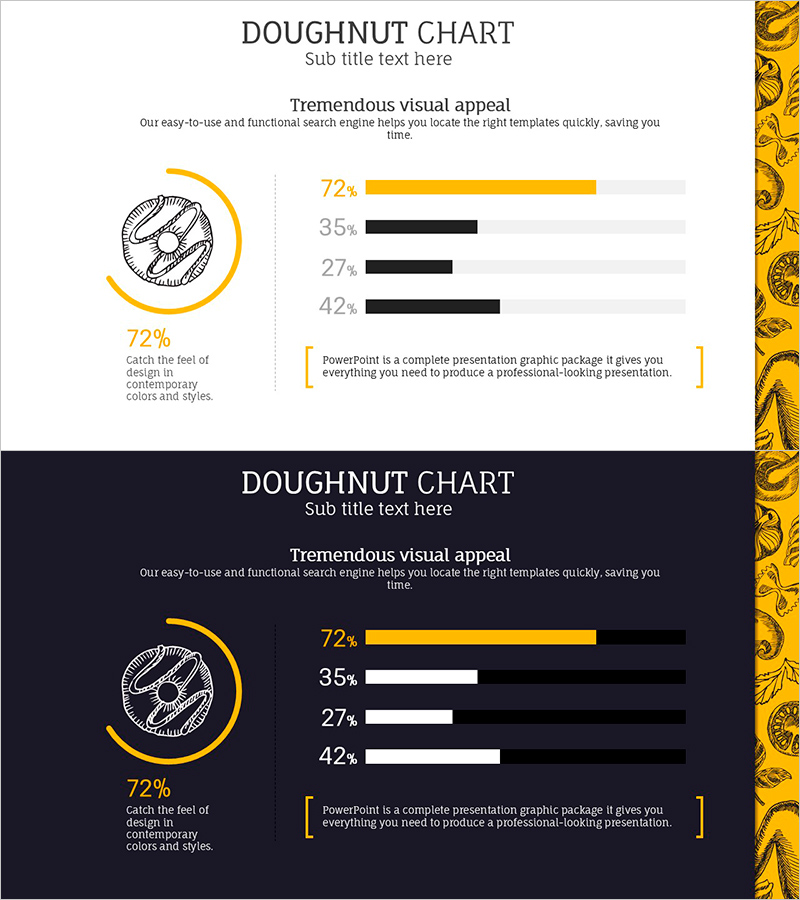
Sales Status by Donut Product Visualization – Attractive Graph Design
RJ0800003_9
- Last Update 12/21/2025
- File Size 0.5MB
- # of Slides 2
- File Format PPTX
- Slide Ratio 16:9
- Color
Keywords
About the Product
This slide utilizes a doughnut chart to intuitively present the sales status of different donut products. The combination of yellow and dark tones captivates the audience's attention while clearly conveying the sales proportions of each product. It is particularly suitable for market and competitor analysis, effectively communicating product performance to customers. This slide can be used effectively in various business strategy meetings or product presentations. The text and graph replacements are straightforward, and the editing difficulty is rated as 'easy'.
Related Products
-
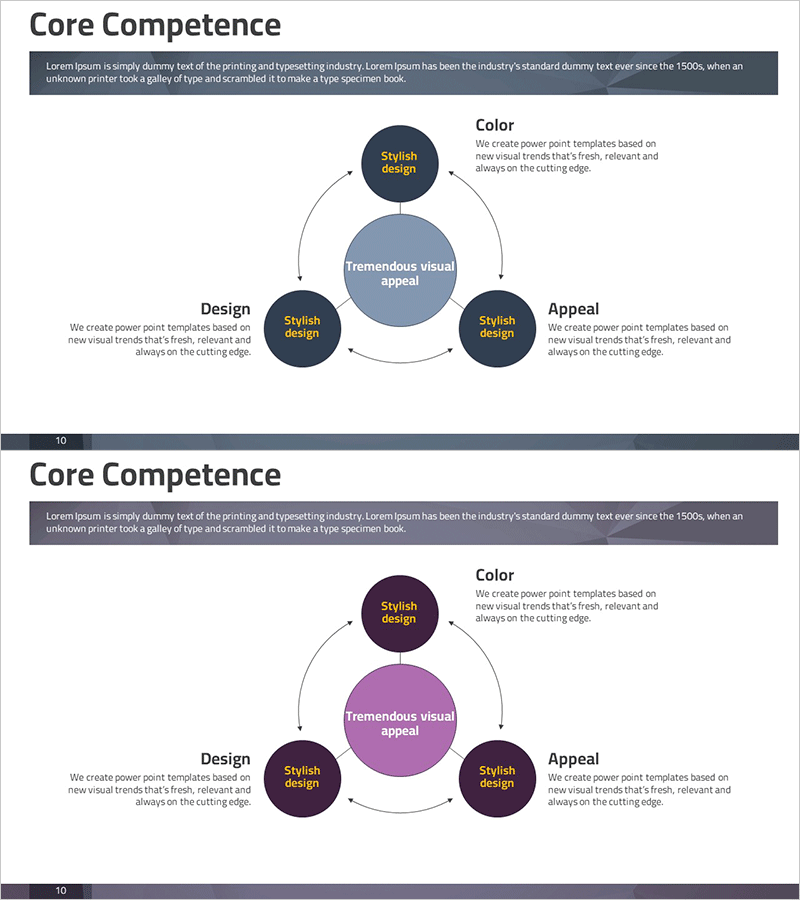
Key Feature Analysis Diagram
#Product/Service #Business Vision and Strategy #Diagram
-
Business Service Characteristics Diagram – Organized in Cluster Format
#Company Introduction #Product/Service #Diagram
-

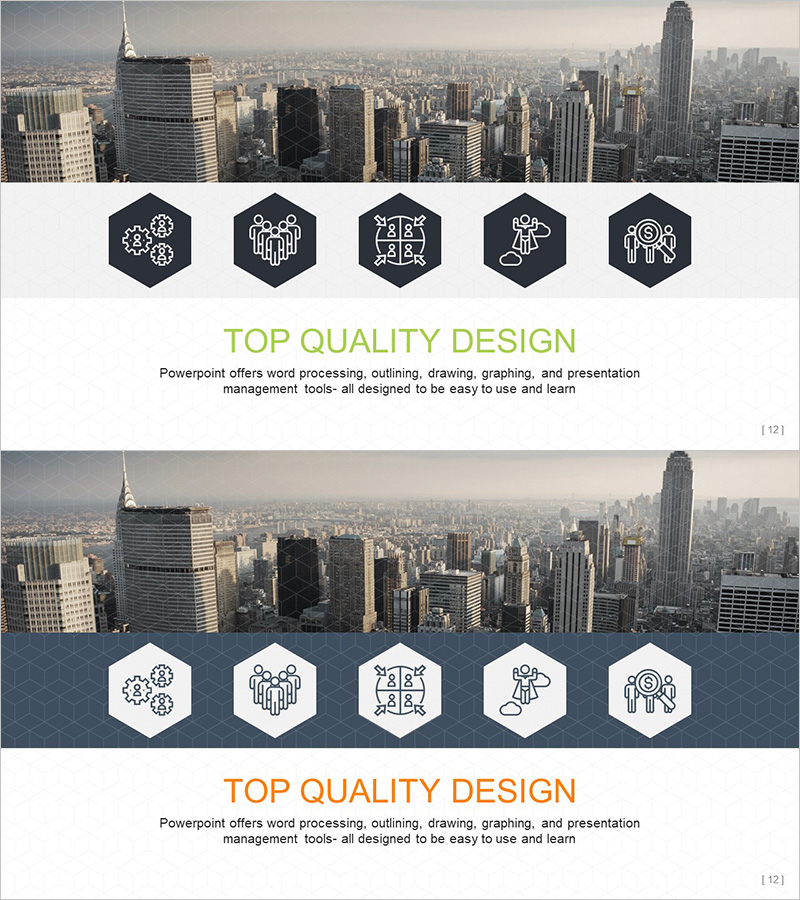
Warm Nature Image Mockup – Perfect for Product Presentations
#Product/Service #Other #Product/Service Introduction
-
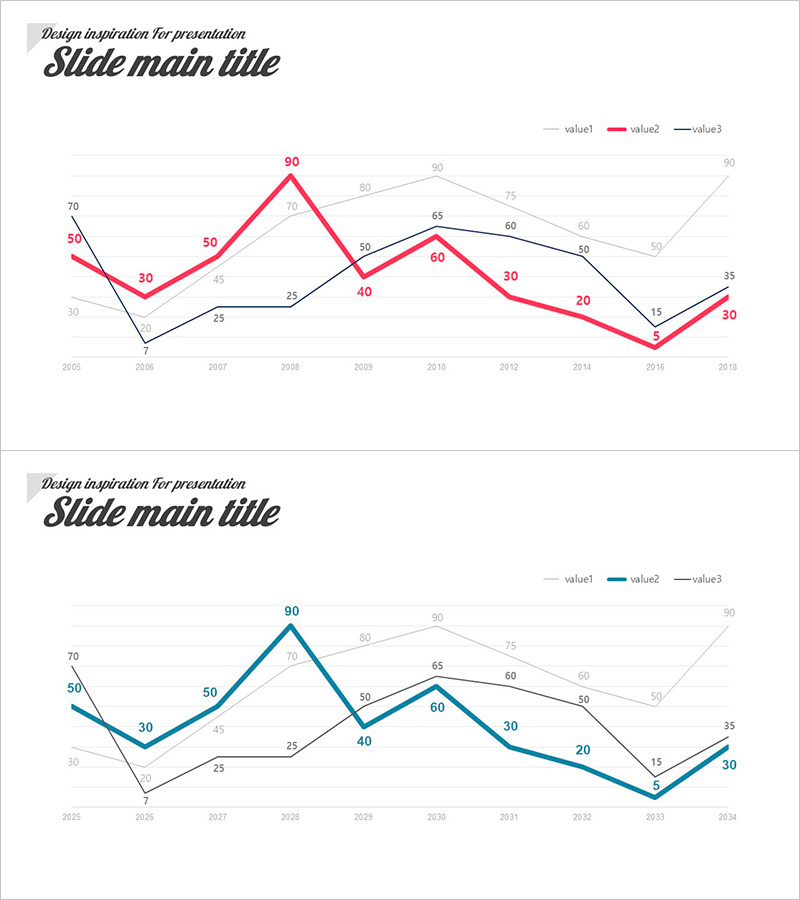
Performance Analysis Visualization with Line Graph – Challenge and Success
#Business Promotion Strategy #Financial Plans and Performance #Graph
