Company Introduction
Experimental Area Diffusion Diagram – Customizing Business Introduction
RJ0700026_25
- Last Update 12/21/2025
- File Size 0.1MB
- # of Slides 2
- File Format PPTX
- Slide Ratio 16:9
- Color
Keywords
About the Product
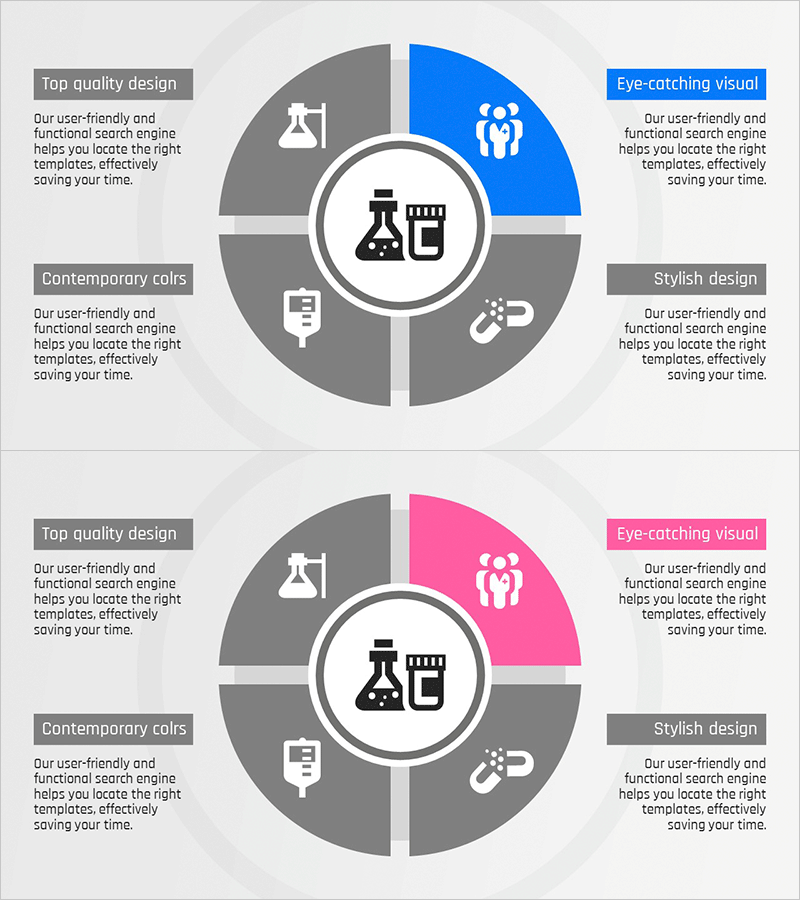
This slide visually conveys information about various business areas using a diffusion diagram centered on the experimental area. It clearly distinguishes between business sectors based on each quadrant and presents essential data to be observed in the center element. The harmonious combination of blue, red, and gray colors enhances visual stability and focus. It is particularly effective for business introductions and proposals, clearly communicating collaboration structures among team members. The text and graphics can be easily replaced, with an overall editing difficulty rated as 'easy'.
Related Products
-
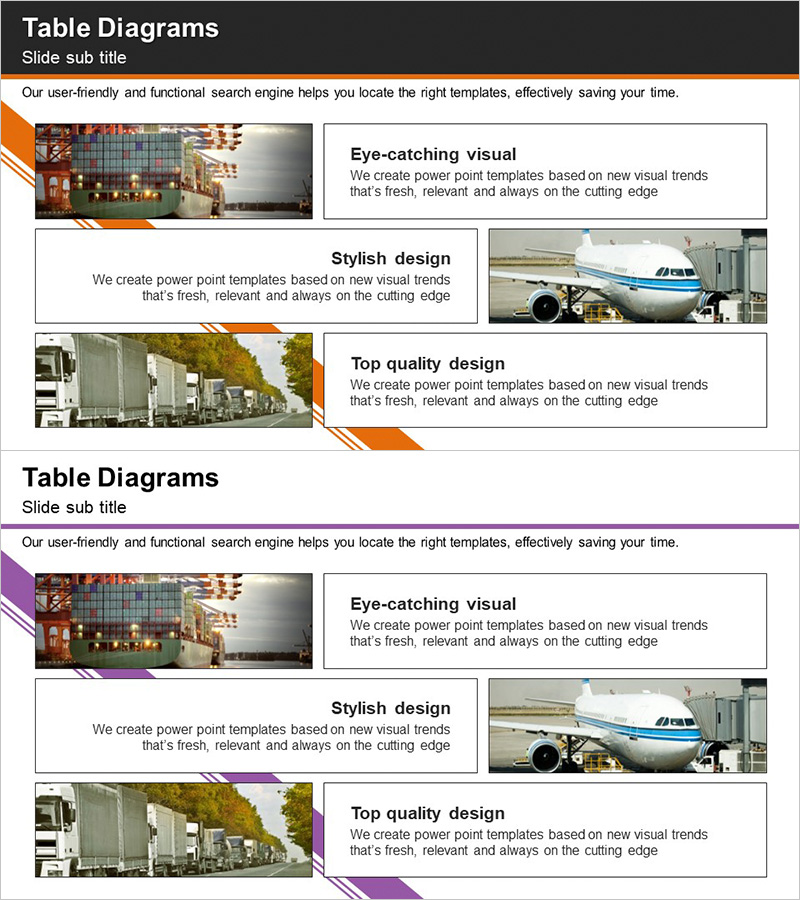
Introduction to Trade Business Transportation – Cluster Diagram
#Product/Service #Diagram #Product/Service Introduction
-

Illustration Rounding Schedule – Effective Schedule Management
#Diagram
-
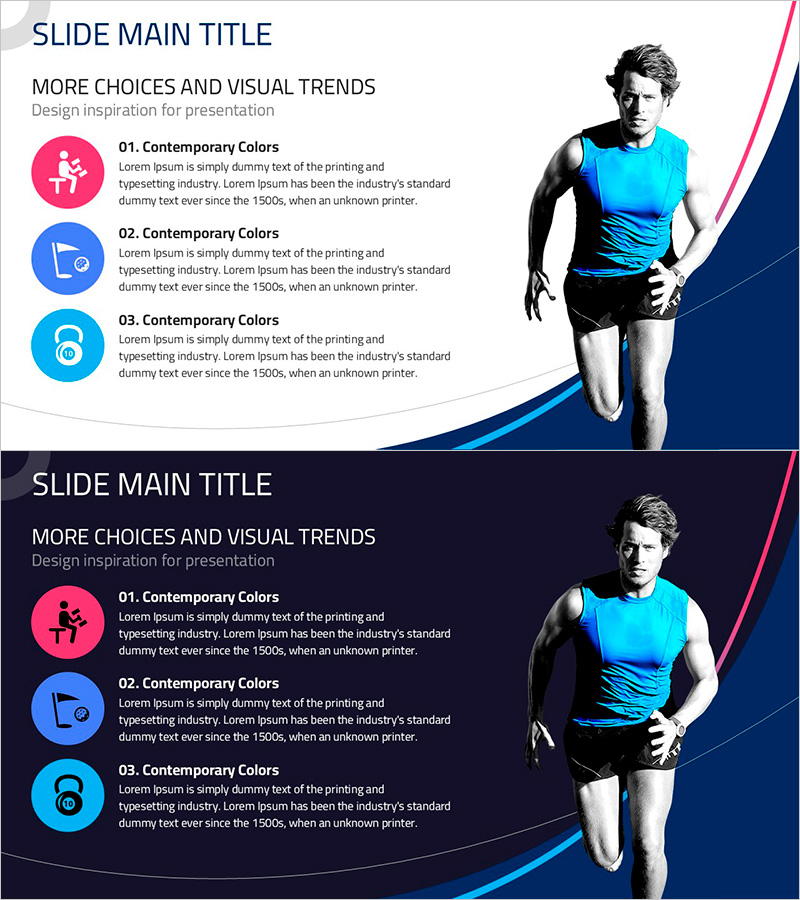
Visualizing Strength Exercise Strategy with Diagram Slide
#Operation Plan #Diagram #Production and Technological Development Strategy
-

Introduction of Key Personnel Organizational Chart Diagram – Effective Team Structure
#Company Introduction #Diagram #Manpower
